


Learn Agentic AI for Workplace Productivity | NIIT
PYTHON FOR DATA ANALYSIS: BUILD A COMPLETE WORKFLOW
Data analysis is not about using one software tool to study numbers. It is a complete process that starts with collecting and storing data, finding answers through queries, analysing patterns, creating visual reports, and explaining the results. The python programming language is an important part of this process because it helps analysts clean, organise, analyse, and automate data. When Python is combined with SQL, Tableau, and AI tools, students can build a complete workflow for modern data analysis.
What Is a Data Analysis Workflow?
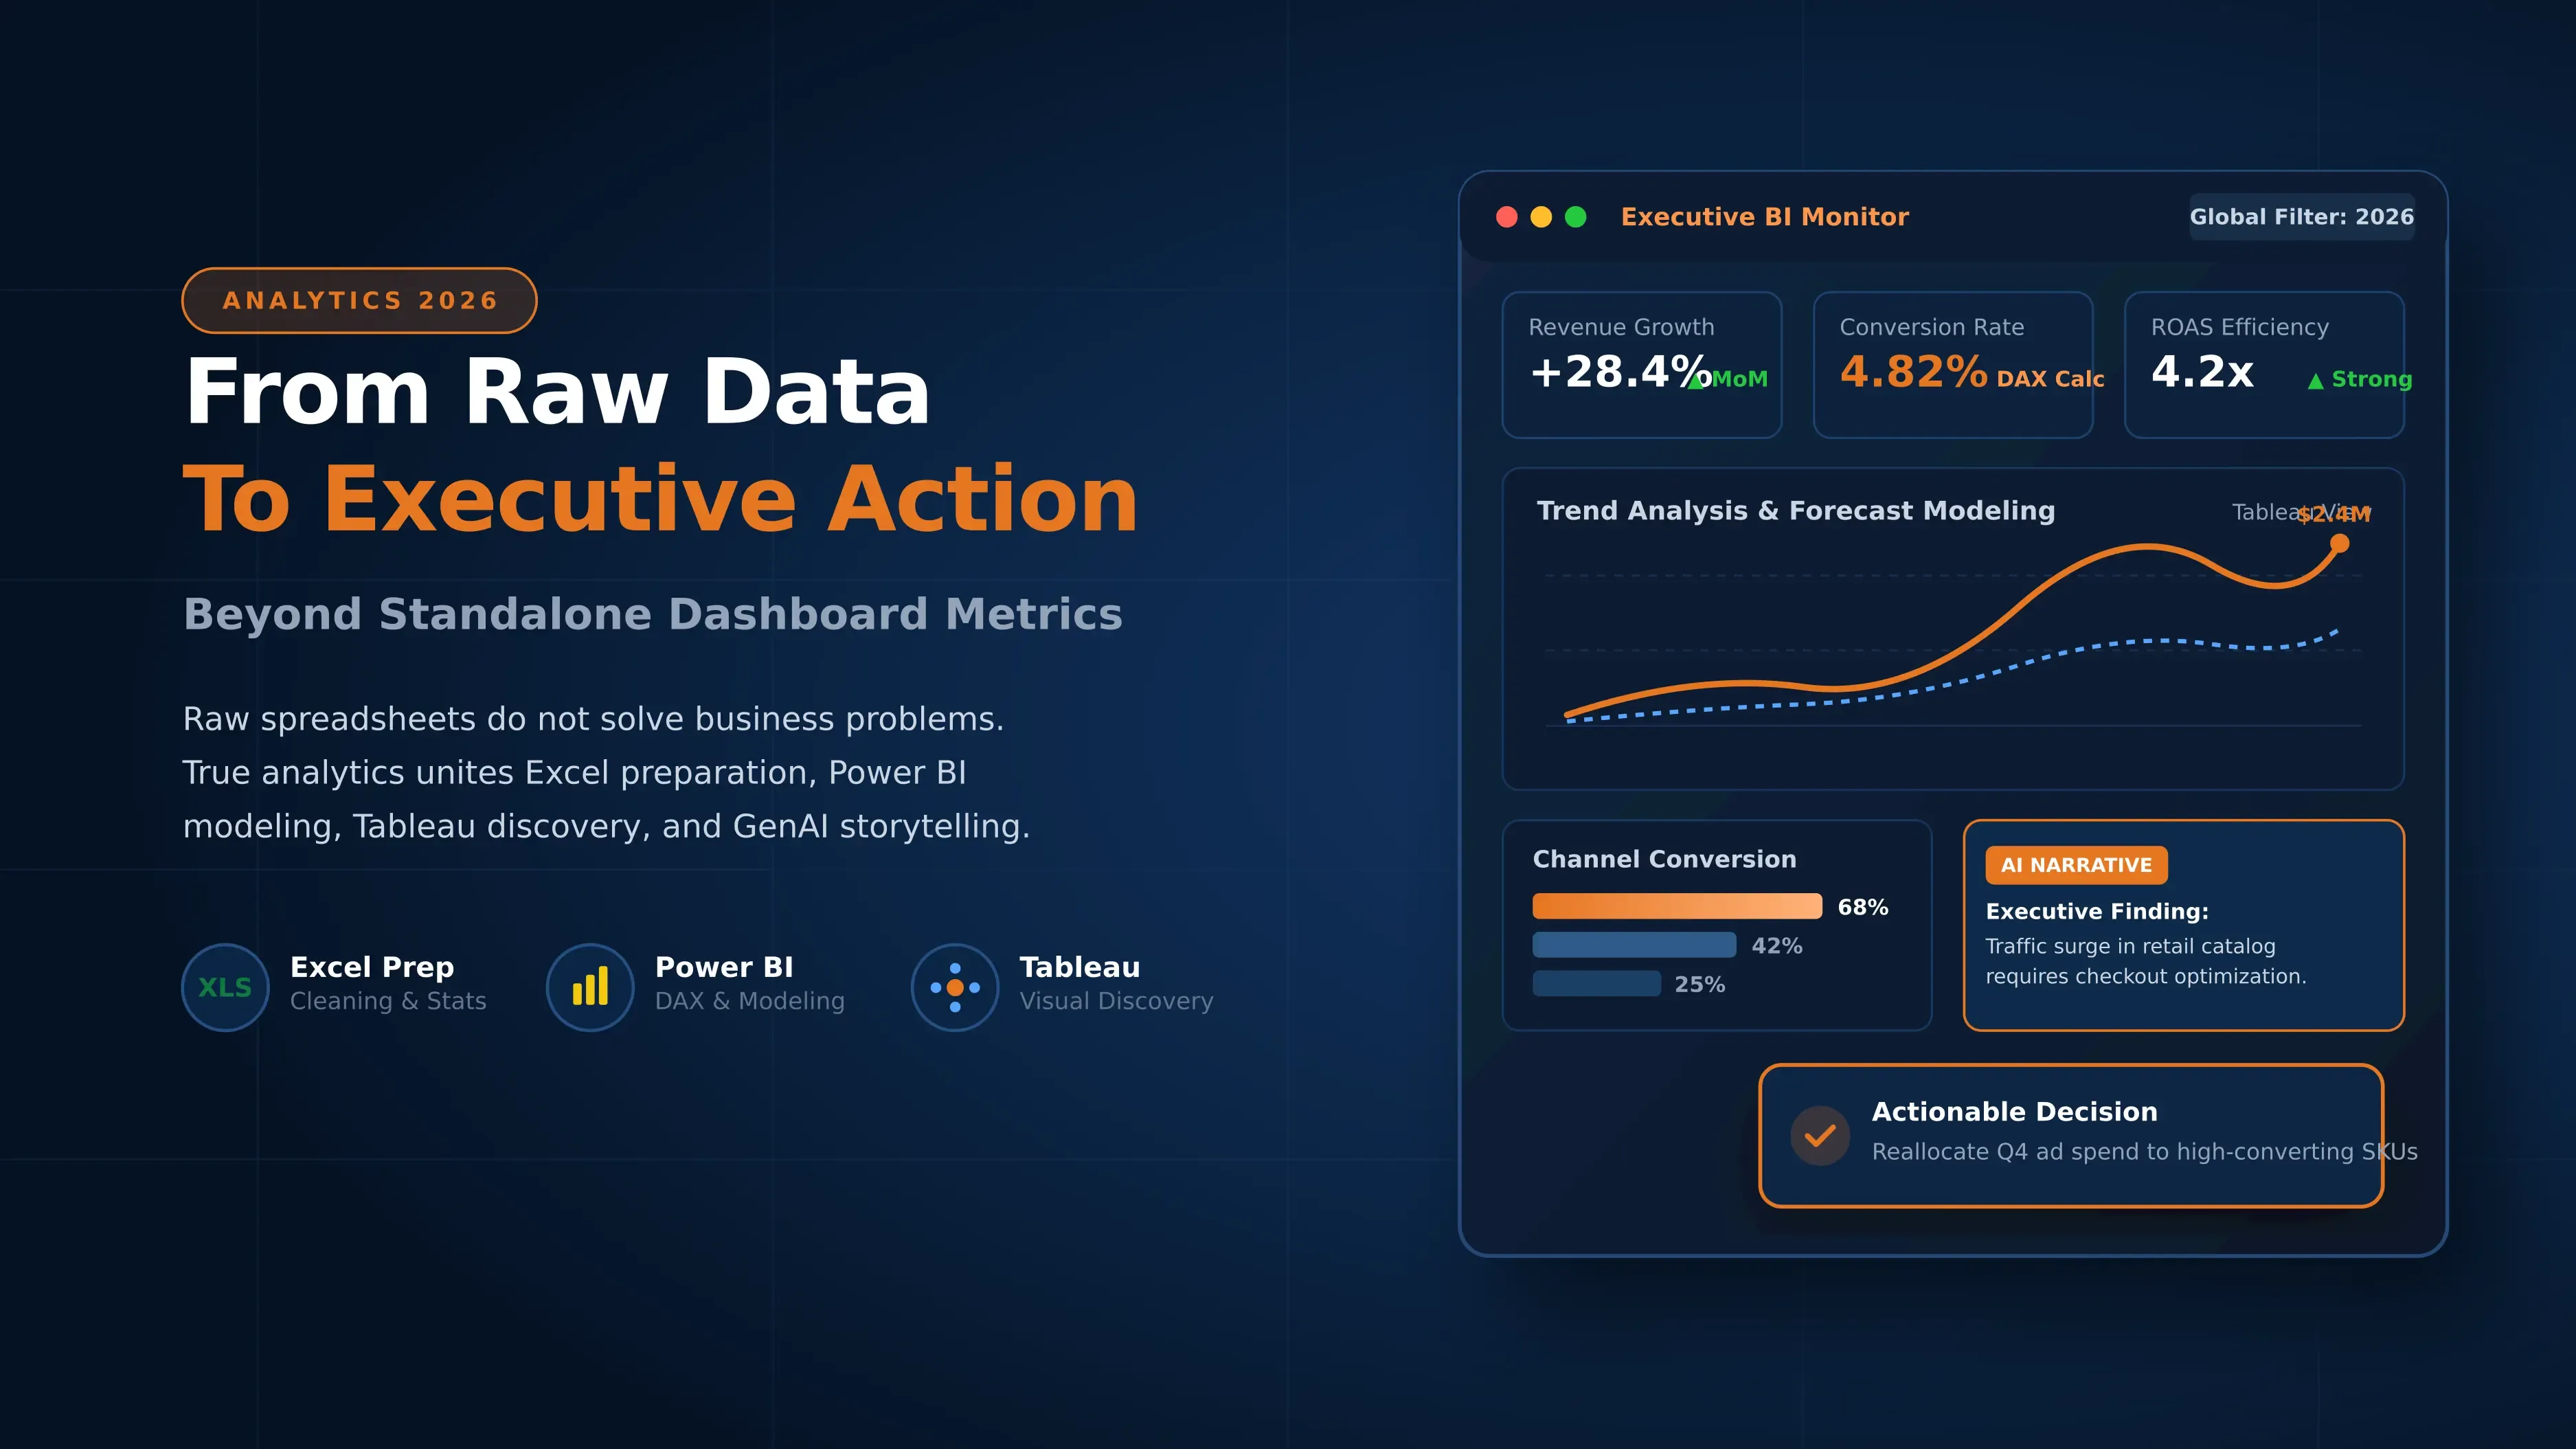
A data analysis workflow is a series of steps used to turn raw data into useful information. Data may come from sales systems, websites, customer records, applications, surveys, or other sources. Before making a decision, an analyst needs to understand whether the data is accurate, what questions it can answer, and how the findings should be presented.
A typical workflow includes storing data, querying it, preparing it, analysing it, visualising the results, and communicating the findings. Different tools can support different stages of this process.
For a beginner, understanding this complete workflow is more useful than learning tools separately. It shows how SQL, Python, Tableau, and AI can work together to solve practical business problems.
Step 1: Store and Manage Data with SQL
Many organisations store large amounts of structured information in databases. SQL, or Structured Query Language, is commonly used to work with these databases.
SQL allows analysts to retrieve, filter, sort, group, and combine information. For example, a retail company may store customer details, orders, products, and payments in separate database tables. An analyst can use SQL to bring the required information together for analysis.
Students interested in data analysis can begin with sql courses to understand how databases work and how information is organised. A good sql language course should cover practical concepts such as SELECT statements, filtering, sorting, grouping, joins, and basic functions.
SQL is especially useful when the amount of data is too large or complex to manage effectively through spreadsheets.
Step 2: Query Data to Find Answers
Data analysis starts with questions. A business may want to know which products are selling the most, why customer cancellations have increased, or which marketing channel is generating the most sales.
SQL helps analysts answer these questions by allowing them to retrieve specific information from databases. For example, an analyst could find monthly sales by product category or compare customer purchases across different regions.
Learning SQL therefore involves more than memorising commands. Students should learn to translate a business question into a data question and then create a query that can provide useful information.
Once the required data has been identified, Python can be used for more detailed data preparation and analysis.
Step 3: Use Python to Program and Manipulate Data
Python is widely used for data analysis because it can handle data preparation, calculations, automation, and many other tasks. The python programming language also provides libraries that make working with datasets easier.
Popular Python libraries for data analysis include pandas and NumPy. Analysts can use them to load datasets, identify missing values, remove duplicates, change data formats, combine datasets, and perform calculations.
For example, an analyst may receive a customer dataset containing missing age values, duplicate records, and inconsistent date formats. Python can help clean the data and prepare it for further analysis.
Students taking a python online course should therefore practise with real datasets rather than focusing only on basic programming exercises.
Step 4: Analyse Data to Find Patterns and Business Insights
After data has been cleaned, analysts can begin looking for patterns. Python can be used to calculate averages, percentages, growth rates, distributions, correlations, and other useful measures.
For example, an online store may analyse customer orders to find that repeat customers spend more than first time customers. The business can then investigate what encourages customers to return.
This stage requires analytical thinking. A number by itself is not necessarily an insight. An analyst needs to understand what the number means, whether the pattern is reliable, and how it relates to the business question.
Students exploring ai data analytics courses can also learn how AI can support this process, while still checking results carefully before using them.
Step 5: Turn Analysis into Visual Insights with Tableau
Data can be difficult to understand when it is presented only as tables and numbers. Tableau helps analysts create charts, dashboards, and interactive visualisations that make patterns easier to see.
For example, an analyst can create a dashboard showing sales trends by month, product category, and region. Business teams can use filters to explore specific areas.
Good visualisation is not about filling a dashboard with as many charts as possible. Each visual should have a clear purpose. The choice of chart should depend on the question being answered and the type of information being presented.
This is why learning data analysis alongside visualisation can be more useful than learning Tableau as an isolated tool.
Step 6: Communicate Data Through Storytelling
A data analyst often needs to explain findings to managers, business teams, or clients who may not have technical knowledge. Data storytelling helps connect numbers with a clear message.
Suppose an analyst discovers that sales dropped sharply in one region. Instead of simply showing a graph, the analyst can explain when the decline began, which products were affected, and how the region compares with others.
The final presentation should help the audience understand three things: what happened, why it may have happened, and what questions should be considered next.
Communication skills are therefore an important part of becoming a successful data analyst.
How AI Is Changing the Data Analysis Workflow
AI is becoming part of many data analysis workflows. AI tools can help generate SQL queries, explain code, suggest Python functions, summarise datasets, identify possible patterns, and assist with reports.
This has also created interest in ai programming with python, where Python is used with AI and machine learning tools to build or automate data related tasks.
The combination of ai and python can help analysts automate repetitive work and explore data faster. However, analysts still need to verify results. AI can produce incorrect queries, misunderstand a business question, or identify a pattern that does not have practical meaning.
The role of the analyst is therefore changing from simply performing calculations to asking better questions, checking results, and using technology responsibly.
SQL vs Python vs Tableau: What Does Each Tool Do?
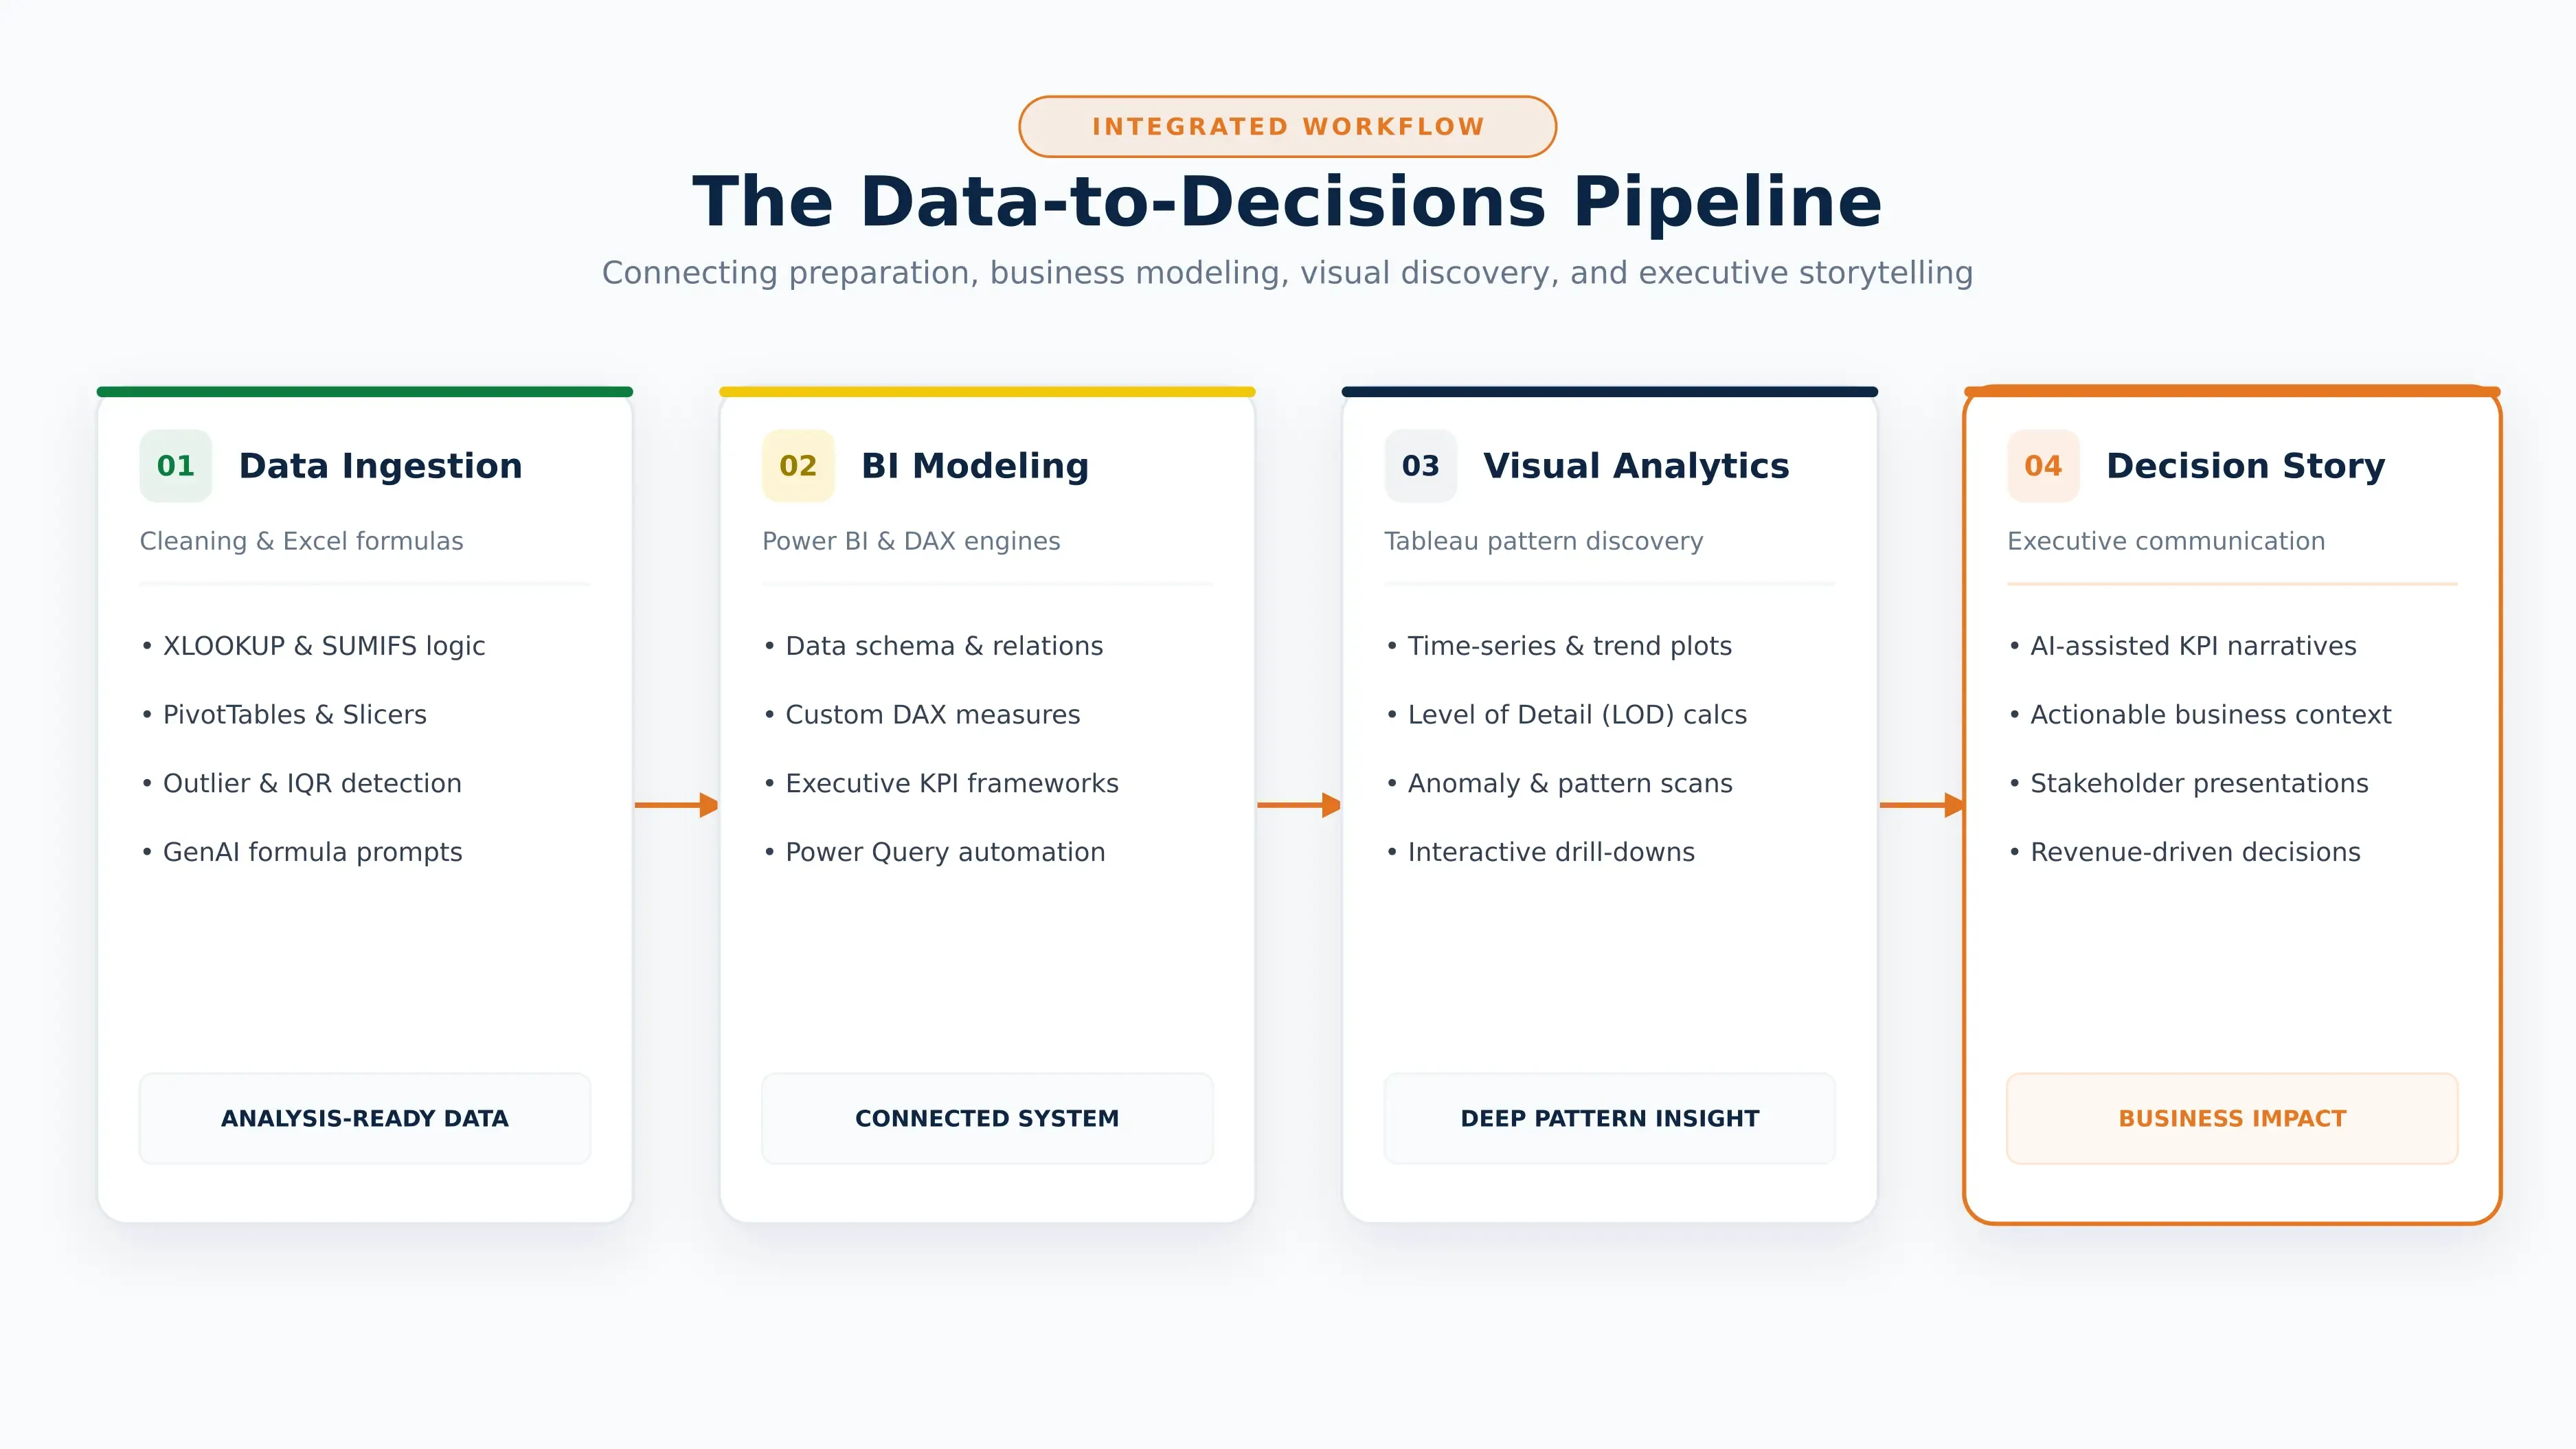
SQL, Python, and Tableau support different parts of the data analysis workflow.
| Tool | Main Purpose | Common Uses |
|---|---|---|
| SQL | Working with databases | Querying, filtering, joining, and aggregating data |
| Python | Data preparation and analysis | Cleaning, calculations, automation, statistical analysis |
| Tableau | Data visualisation | Charts, dashboards, interactive reports |
An analyst may use SQL to retrieve data from a database, Python to clean and analyse it, and Tableau to present the findings.
The tools are therefore complementary rather than direct replacements for one another. A structured learning path can help students understand how each tool fits into the complete workflow.
Case Study
Consider an online retailer that notices a decline in monthly sales. The business wants to understand the reason.
The analyst first uses SQL to retrieve order, product, customer, and regional data from the company's database. The analyst then uses Python to clean the information, remove duplicate records, handle missing values, and calculate important sales measures.
Further analysis shows that sales have fallen mainly among first time customers. The analyst then uses Tableau to create a dashboard showing customer type, product category, region, and monthly sales.
The dashboard makes the pattern easier for the management team to understand. The team can then investigate possible reasons for the decline, such as changes in pricing, customer experience, or marketing campaigns.
This example shows how a complete workflow connects different technologies. No single tool performs the entire process.
What Skills Does a Modern Data Analyst Need?
A modern data analyst needs more than knowledge of one programming language or visualisation platform. Important skills include:
- SQL and database fundamentals
- Python programming and data manipulation
- Data cleaning and preparation
- Basic statistics
- Data visualisation
- Tableau or another business intelligence tool
- Problem solving and analytical thinking
- Business understanding
- Data storytelling and communication
- AI assisted analysis and automation
- The ability to verify and explain analytical results
Students can develop these skills through structured programs that combine theory, practice, projects, and real datasets.
Why is the Data Analysis Applied Program by NIIT a strong choice?
The Data Analysis Applied Program by NIIT is designed for students and early-career learners who want to build practical skills in data management, programming, analytics, visualization, and business communication. The program follows a structured data workflow: Store, Query, Program, Analyze, Visualize, and Communicate.
Learners begin with SQL and relational databases, progress to Python programming, and then learn Tableau for data visualization and Business Intelligence. This creates a connected learning journey where learners can work with data from storage and querying to analysis, visualization, and communication.
The program also integrates AI-assisted learning into the analytics workflow. Learners use AI tools for SQL generation, coding, debugging, query optimization, database design, and data exploration, while learning to validate AI-generated outputs. Hands-on projects, assignments, case studies, and portfolio development further support practical skill building.
Program at a Glance
| Program Feature | Details |
|---|---|
| Program Name | Data Analysis Applied Program |
| Provider | NIIT |
| Duration | 128 Hours |
| Core Focus | Data Management, SQL, Python, Data Analytics, Data Visualization, Business Intelligence |
| Data Workflow | Store, Query, Program, Analyze, Visualize, Communicate |
| Primary Technologies | SQL, Python, Tableau |
| Database | MySQL |
| AI Tools | GitHub Copilot and AI-assisted analytics workflows |
| Learning Approach | Hands-on, applied learning, projects, assignments, case studies |
| Methodology | Structured learning roadmap, mentor interactions, AI-assisted learning, performance tracking |
| Projects | Relational Database Design & Business Intelligence System |
| Case Studies | Sales Data Analysis, Bird Strike Data Analysis |
| Certification | NIIT Professional Certificate |
| Program Fee | ₹24,999 + 18% GST |
What Does the Data Analysis Applied Program Cover?
The curriculum is structured across three modules. It begins with SQL and database management, moves into Python programming foundations, and concludes with Tableau-based data visualization and Business Intelligence.
| Module | Duration | Key Areas |
|---|---|---|
| Data Analytics and Managing Data using SQL | 60 Hours | Relational databases, SQL, database design, advanced queries, database programming, security, transactions, ETL, AI-assisted SQL |
| Python for Data Science, Foundations | 32 Hours | Python programming foundations |
| Data Visualization & Business Intelligence using Tableau, Self-Paced | 36 Hours | Tableau, data visualization, Business Intelligence, advanced visual analytics |
Module 1: Data Analytics and Managing Data using SQL
Duration: 60 Hours
This module establishes the foundation for working with structured data and relational databases. Learners progress from basic SQL queries to advanced database operations, database design, analytics workflows, and AI-assisted SQL development.
| Area | What Learners Cover |
|---|---|
| Relational Databases & SQL Fundamentals | Understand relational databases, tables, keys, and relationships; set up MySQL; retrieve data using filtering, sorting, grouping, and aggregation; use built-in SQL functions; apply AI-assisted query generation |
| Data Retrieval & SQL Analytics | Work with SELECT, WHERE, GROUP BY, HAVING, ORDER BY, and CASE; use string, date, and aggregate functions; generate analytical reports and summaries; debug and optimize queries using AI assistants |
| Multi-Table Queries & Advanced SQL | Use INNER, LEFT, RIGHT, CROSS, and SELF JOINs; apply UNION, Common Table Expressions, subqueries, and window functions; solve analytical problems; generate AI-assisted SQL solutions |
| Database Design & Schema Management | Create Entity-Relationship diagrams; apply 1NF, 2NF, and 3NF normalization; create and manage database objects using DDL commands; validate schemas using AI-assisted tools |
| Data Management & Database Programming | Insert, update, delete, and clean data using DML; create views, indexes, stored procedures, user-defined functions, and triggers; automate database operations; optimize SQL code using AI-assisted recommendations |
| Database Security & Transaction Management | Apply COMMIT, ROLLBACK, and SAVEPOINT; understand ACID properties and database locking; manage roles, permissions, and DCL commands; maintain data consistency |
| SQL Analytics & AI-Augmented Workflows | Work with semi-structured JSON data using SQL; build SQL-based ETL workflows and reporting pipelines; automate SQL generation, optimization, debugging, and documentation using GenAI tools |
Hands-on Activity
Learners complete a two-phase course-end project, demonstrate their learning through a course-end assessment, and present the final project across two sprints to demonstrate end-to-end analytics and business problem-solving competency.
Module 2: Python for Data Science, Foundations
Duration: 32 Hours
The second module introduces Python programming foundations as part of the broader data workflow. Learners develop programming skills that support logical problem-solving and reusable applications.
| Area | What Learners Develop |
|---|---|
| Python Programming Fundamentals | Build a foundation in Python programming |
| Functions | Develop reusable program components using functions |
| Data Structures | Work with Python data structures |
| Object-Oriented Programming | Understand and apply object-oriented programming concepts |
| File Handling | Work with files through Python programs |
| Exception Handling | Handle errors and exceptions in applications |
| Programming for Data Work | Build programming skills that support the wider data analysis workflow |
Module 3: Data Visualization & Business Intelligence using Tableau
Duration: 36 Hours, Self-Paced
The third module focuses on communicating data through visualization and Business Intelligence using Tableau. Learners use visual analytics techniques to identify patterns, trends, and insights.
| Area | Focus |
|---|---|
| Tableau | Build data visualizations and Business Intelligence solutions |
| Interactive Dashboards | Create dashboards to communicate analytical findings |
| Data Visualization | Represent data visually to identify trends and patterns |
| Business Intelligence | Use visualization to support business reporting and decision-making |
| Advanced Visual Analytics | Apply time-series, spatial, relational, distribution, trend, correlation, LOD, and table calculation techniques |
| Business Communication | Communicate analytical insights through visualizations and dashboards |
AI-Assisted Data Analysis Approach
AI is integrated into several stages of the program's data and programming workflow. Learners use AI to improve productivity while validating the outputs generated by AI tools.
| Area | AI-Assisted Application |
|---|---|
| SQL Development | Generate SQL queries and solutions |
| Query Debugging | Identify and resolve SQL issues |
| Query Optimization | Improve SQL queries using AI-assisted recommendations |
| Database Design | Support schema validation and database design |
| Python Development | Support coding and programming tasks |
| Debugging | Assist with identifying and resolving coding errors |
| Code Optimization | Improve code using AI-assisted suggestions |
| Data Exploration | Support exploratory analysis |
| Documentation | Assist with SQL documentation |
| Analytics Workflow | Accelerate analysis while validating AI-generated outputs |
Tools and Technologies
Learners work with industry-relevant tools across database management, programming, AI-assisted development, and visualization.
| Tool / Technology | Application |
|---|---|
| SQL | Database querying, analytics, and data management |
| MySQL | Relational database management |
| Python | Programming and data-related tasks |
| Google Colab | Python-based learning and programming |
| VS Code | Development and coding |
| GitHub Copilot | AI-assisted coding and development |
| Tableau | Data visualization and Business Intelligence |
Projects Learners Build
The program combines hands-on project work with business-focused case studies to help learners apply their technical and analytical skills.
| Project / Case Study | What Learners Work On |
|---|---|
| Relational Database Design & Business Intelligence System | Design, implement, and query relational databases to solve business problems, automate reporting, and generate actionable insights; create a database schema, SQL scripts, SQL query portfolio, and project presentation |
| Case Study: Sales Data Analysis | Analyze sales distribution, identify patterns and trends, and use Tableau visualizations to evaluate sales performance and support trend-based decision-making, including future demand and inventory planning |
| Case Study: Bird Strike Data Analysis | Analyze yearly and quarterly bird-strike incidents, airline damage costs, and the number of people injured using Tableau; identify and communicate key patterns and trends |
Business Scenarios Covered
| Project / Case Study | Example Business Areas |
|---|---|
| Relational Database Design & Business Intelligence System | Retail & E-commerce Analytics, Healthcare Analytics, Education Analytics, Media & Entertainment Analytics, Food & Hospitality Analytics |
| Sales Data Analysis | Retail & Sales Analytics, Sales Analytics, Demand Forecasting, Inventory Planning, Retail Performance Management |
| Bird Strike Data Analysis | Aviation, Aviation Safety, Risk Management, Airline Operations, Cost Analysis, Data Analytics |
Learning Outcomes
By the end of the program, learners develop practical technical and analytical capabilities across the data workflow.
| Learning Outcome | Skills Developed |
|---|---|
| Manage Structured Data | Understand, organize, and manage structured data using relational databases, SQL, and MySQL |
| Follow the Complete Data Workflow | Apply Store, Query, Program, Analyze, Visualize, and Communicate to real-world data and business problems |
| Develop Python Programs | Use programming fundamentals, functions, data structures, object-oriented programming, file handling, and exception handling |
| Design Relational Databases | Create ER diagrams, apply normalization, and automate database operations using advanced SQL |
| Create Tableau Solutions | Build interactive dashboards, visualizations, and business reports |
| Analyze Data | Apply data preparation, transformation, and exploratory analysis techniques using SQL, Python, and Tableau |
| Use AI-Assisted Development | Accelerate SQL generation, Python coding, debugging, optimization, database design, and exploratory analysis while validating AI outputs |
| Communicate Insights | Present analytical findings through dashboards, visualizations, and business storytelling |
| Build a Portfolio | Create SQL solutions, Python applications, Tableau dashboards, assignments, and a course-end project |
| Prepare for Career Opportunities | Build a foundation for internships, higher education, and entry-level roles in data analytics, programming, Business Intelligence, and technology-driven careers |
Industry-Recognized Certification
Learners receive an NIIT Professional Certificate after successful completion of the program.
| Certification Benefit | Details |
|---|---|
| Global Recognition | Accepted by leading employers and organizations worldwide |
| Easy Sharing | Can be added to LinkedIn, resumes, and professional portfolios |
| Career Value | Demonstrates practical skills aligned with industry needs |
| Certificate | Certificate of Completion for the Data Analysis Applied Program |
Data-Driven Learning Methodology
The program uses a structured learning ecosystem to support learner progress and practical skill development.
| Learning Feature | How It Supports Learners |
|---|---|
| Structured Learning Roadmap | Provides clear learning pathways through the LMS with defined milestones and module progression |
| Learner Connect Sessions | Regular live mentor interactions help resolve doubts, reinforce concepts, and maintain engagement |
| AI-Assisted Faculty Quality Monitoring | AI-assisted faculty performance analysis supports consistent teaching quality and delivery |
| Program Performance Report | Tracks attendance, assignments, assessments, quizzes, and overall performance |
| Applied Case Studies | Helps learners apply technical concepts to real-world business scenarios |
| Advanced Visual Analytics | Provides exposure to time-series, spatial, relational, distribution, trend, correlation, LOD, and table calculation techniques |
Career and Portfolio Development
The program focuses on creating practical work that can demonstrate a learner's technical and analytical capabilities.
| Portfolio Element | What It Demonstrates |
|---|---|
| SQL Query Portfolio | Database querying, data retrieval, analytical SQL, and problem-solving |
| Database Schema | Relational database design and normalization |
| SQL Scripts | Practical database implementation and management |
| Python Applications | Programming fundamentals and logical problem-solving |
| Tableau Dashboards | Data visualization and Business Intelligence |
| Course-End Project | End-to-end application of data management and analytics skills |
| Project Presentation | Ability to communicate technical and analytical work |
Learners can also showcase professional project work on LinkedIn and in their portfolios to demonstrate practical skills.
Who Can Consider This Program?
| Learner Profile | How the Program Can Help |
|---|---|
| Students | Build a practical foundation in data management, programming, analytics, and visualization |
| Early-Career Learners | Develop technical skills relevant to data and technology-driven careers |
| Aspiring Data Analysts | Learn SQL, Python, Tableau, and practical data analysis workflows |
| Aspiring Business Intelligence Professionals | Build skills in databases, analytics, dashboards, and visualization |
| Learners Interested in Programming | Develop Python programming foundations |
| Learners Interested in Databases | Build practical SQL and relational database skills |
| Learners Interested in AI-Assisted Development | Learn how AI can support SQL, coding, debugging, optimization, and data exploration |
| Learners Preparing for Higher Education | Build a foundation in programming, databases, analytics, and visualization |
Duration, Batch and Fee
| Program Detail | Information |
|---|---|
| Total Duration | 128 Hours |
| Upcoming Batch | 02 November |
| Batch Type | Weekday |
| Schedule | Monday, Tuesday, Thursday, Friday, 07:30 PM to 09:30 PM |
| Custom Schedule | Custom Schedule Assistance available |
| Program Fee | ₹24,999 |
| GST | 18% GST applicable |
| Payment Mode | Upfront payment option available |
Ready to turn raw data into useful insights?
Explore NIIT Digital's Applied Data Analysis Program and start building practical skills for a modern data career.
Explore the ProgramFrequently Asked Questions
1. Why is Python used for data analysis?
Python is useful for data analysis because it can handle data cleaning, manipulation, calculations, automation, and visualisation. Libraries such as pandas and NumPy also provide tools for working with datasets efficiently.
2. Should I learn SQL or Python first for data analysis?
Both are useful. SQL helps students understand databases and retrieve information, while Python is useful for data preparation, analysis, and automation. The order can depend on the learner's background and the learning program.
3. Is Tableau necessary for a data analyst?
Tableau is not the only data visualisation option, but learning it can help students create interactive dashboards and communicate analytical findings clearly.
4. Can AI replace Python and SQL in data analysis?
AI can assist with many tasks involving SQL and Python, but it does not remove the need to understand the tools. Analysts still need to check data, validate results, understand business questions, and explain findings.
5. What should I learn to start a data analyst career?
Beginners can start with SQL, Python, data cleaning, basic statistics, data visualisation, and communication. Learning Tableau and AI supported analysis can add useful skills as learners progress.
NIIT
Expert Contributor
Industry expert contributing to NIIT's knowledge base on technology and education.