


Data Analysis Applied Program
Build practical data analytics skills with SQL, Python, and Tableau through hands-on learning in database management, programming, data visualization, business insights, and AI-assisted analytics for future-ready careers and technology-driven career readiness.
Program Overview
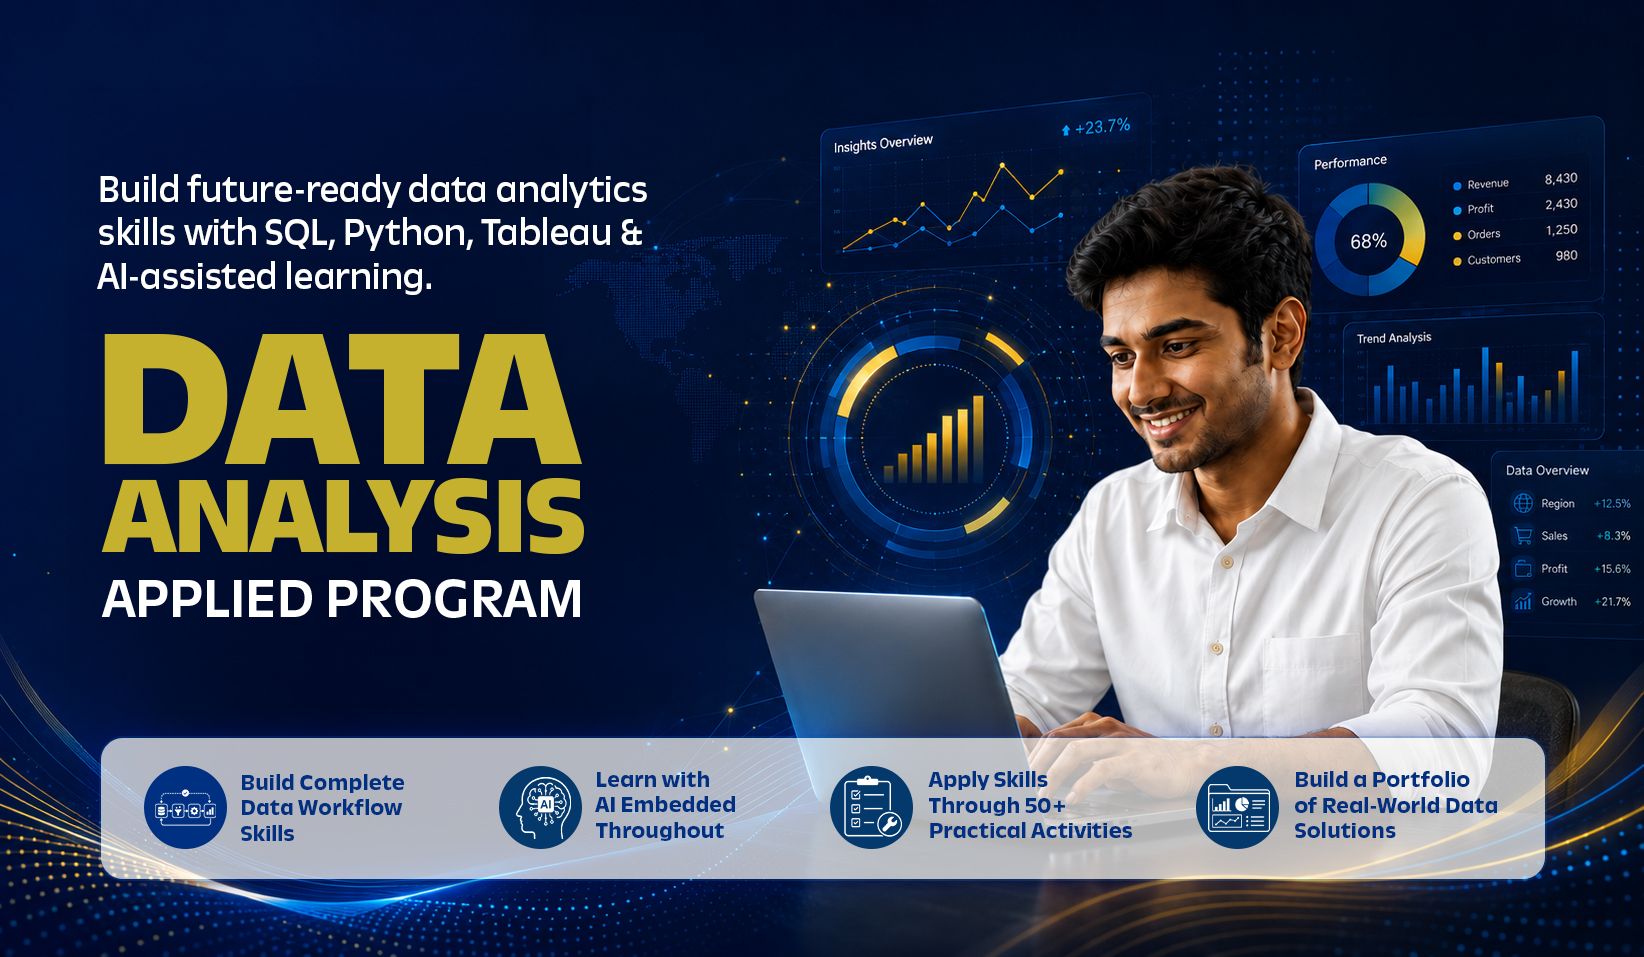
Data Analysis Applied Program by NIIT builds practical skills in data management, programming, analytics, and visualization. Designed for students and early-career learners, it covers the data workflow: Store, Query, Program, Analyze, Visualize, and Communicate. Learners use SQL to design and query relational databases, Python to program and automate tasks, and Tableau to build dashboards and communicate insights. AI-assisted learning supports SQL generation, coding, debugging, query optimization, and data exploration, improving productivity while strengthening analytical thinking. Industry-standard tools build confidence for academic and career success.
Curriculum
Comprehensive curriculum to build in-demand tech skills and real-world expertise.
Relational Databases & SQL Fundamentals
Understand relational database concepts, tables, keys, and relationships; set up MySQL; retrieve data using SQL queries with filtering, sorting, grouping, and aggregation; and apply built-in SQL functions with AI-assisted query generation.
Data Retrieval & SQL Analytics
Write SQL queries using SELECT, WHERE, GROUP BY, HAVING, ORDER BY, and CASE; apply string, date, and aggregate functions; generate analytical reports and summaries; and debug and optimize queries using AI assistants.
Multi-Table Queries & Advanced SQL
Combine data using INNER, LEFT, RIGHT, CROSS, and SELF JOINs; apply UNION, Common Table Expressions (CTEs), subqueries, and window functions; solve analytical problems; and generate AI-assisted SQL queries and solutions.
Database Design & Schema Management
Design Entity-Relationship (ER) diagrams; apply normalization (1NF, 2NF, and 3NF) to create efficient database structures; create and manage database objects using DDL commands; and validate schemas using AI-assisted tools.
Data Management & Database Programming
Insert, update, delete, and clean data using DML; create views, indexes, stored procedures, user-defined functions, and triggers; automate database operations; and optimize SQL code using AI-assisted recommendations.
Database Security & Transaction Management
Apply transaction management using COMMIT, ROLLBACK, and SAVEPOINT; understand ACID properties and database locking; manage database security using roles, permissions, and DCL commands; and ensure data consistency.
SQL Analytics & AI-Augmented Workflows
Handle semi-structured JSON data using SQL; build SQL-based ETL workflows and reporting pipelines; automate SQL generation, optimization, debugging, and documentation using GenAI tools; and develop AI-assisted analytics workflows.
Complete a two-phase course-end project, demonstrate learning through a course-end assessment, and present the final project across two sprints to showcase end-to-end analytics and business problem-solving competency.
Python Programming Fundamentals
Understand Python syntax, variables, data types, and operators; write programs using input, output, expressions, and type conversions; develop logical problem-solving skills through programming exercises and practical coding tasks.
Decision Making & Iterative Programming
Implement decision-making using if, elif, and else statements; build iterative programs using for and while loops; apply nested loops and loop control statements to solve business problems efficiently and accurately.
Functions & Modular Programming
Create reusable programs using user-defined functions; work with parameters, return values, local and global variables; apply modules and lambda functions to build modular, reusable, and efficient Python applications.
Data Structures & Data Manipulation
Manipulate strings using indexing and slicing; store and organize data using lists, tuples, sets, and dictionaries; perform searching, updating, sorting, aggregation, and data retrieval operations efficiently in Python.
Object-Oriented Programming (OOP)
Build applications using classes and objects; implement constructors, instance variables, class variables, and methods; apply object-oriented principles to create structured, reusable, and maintainable Python programs.
Exception Handling & File Operations
Handle runtime errors using exception handling techniques; read, write, append, and manage files using Python; build robust programs with effective error handling and reliable file management for business applications.
AI-Assisted Python Development
Use Colab Gemini for code generation and debugging; generate Python code with GitHub Copilot in Visual Studio Code; and interpret errors, optimize code, and improve productivity with AI-assisted workflows.
Learn by doing through hands-on coding practice, applying Python concepts to practical problems and building confidence through continuous application.
Tableau Fundamentals & Data Preparation
Connect to data from multiple sources using Tableau Desktop and Tableau Public; prepare and organize datasets for analysis; create calculated fields, filters, parameters, data transformations, and reusable views for interactive business reporting.
Data Visualization & Visual Analytics
Build effective visualizations using bar, line, area, scatter, histogram, box plot, heat map, treemap, and geographic charts; select suitable visuals and apply visual analytics principles to communicate meaningful business insights effectively.
Time-Series, Spatial & Relational Analysis
Analyze trends using time-series visualizations and forecasting; create geographic and spatial visualizations using maps; explore relationships and correlations across multiple variables through interactive visual analysis for business decisions.
Interactive Dashboards & Data Storytelling
Design interactive dashboards using filters, parameters, actions, and navigation; present KPIs through compelling visual storytelling; and develop executive-ready dashboards that support business decisions with actionable insights.
Advanced Tableau Analytics
Apply Level of Detail expressions and table calculations; build advanced visualizations for trend, distribution, and correlation analysis; analyze complex datasets using exploratory visual analytics to support informed business decisions.
Business Intelligence & Executive Reporting
Monitor business performance using KPI dashboards and executive reports; identify trends, opportunities, and performance drivers; and generate actionable business insights to support strategic planning and executive decision-making.
Exploratory Data Analysis (EDA) using Tableau
Perform exploratory analysis to discover patterns, anomalies, and relationships; apply distribution, trend, and comparative analysis techniques; and interpret analytical findings to support evidence-based business decisions with confidence.
Case Study: Analyze real-world business datasets using Tableau; build interactive dashboards, advanced visualizations, and executive reports; and present business insights and recommendations through professional Tableau presentations.
Tools & Technologies
Explore industry-relevant tools through hands-on learning to master practical, in-demand skills.
Projects You'll Build, Case Studies to Explore
Build production-ready projects and analyze real-world business case studies to develop practical skills, uncover insights, support data-driven decisions, and strengthen your portfolio.
Relational Database Design & Business Intelligence System
Design, implement, and query relational databases to solve business problems, automate reporting, and generate actionable insights, delivering a database schema, SQL scripts, SQL query portfolio, and project presentation.
Case Study: Sales Data Analysis
Analyze sales data to understand sales distribution, identify key patterns and trends, and use Tableau visualizations to evaluate sales performance and support trend-based decision-making, including planning for future product demand and inventory requirements.
Case Study: Bird Strike Data Analysis
Analyze the impact of bird strikes on the aviation industry by using Tableau to visualize yearly and quarterly trends in bird-strike incidents, airline damage costs, and the total number of people injured, and communicate the key patterns, trends, and insights identified from the analysis.
Boost Your Career Visibility
Showcasing a professional Capstone Project on your LinkedIn increases recruiter interest significantly. Build production-ready work that speaks for itself.
Learning Outcomes
Develop industry-relevant skills to create real-world solutions and advance your career.
Understand, organize, and manage structured data using relational databases, SQL, and MySQL to retrieve, manipulate, and analyze information efficiently.
Apply a practical data workflow comprising Store, Query, Program, Analyze, Visualize, and Communicate to solve real-world data and business problems.
Develop Python programs using programming fundamentals, functions, data structures, object-oriented programming, file handling, and exception handling to build logical and reusable applications.
Design relational databases, create efficient database structures using ER diagrams and normalization, and automate database operations using advanced SQL features.
Create interactive dashboards, visualizations, and business reports using Tableau to identify trends, monitor KPIs, and communicate insights effectively.
Apply data preparation, transformation, and exploratory analysis techniques using SQL, Python, and Tableau to uncover meaningful patterns and support data-driven decision-making.
Leverage AI-assisted development tools to accelerate SQL query generation, Python coding, debugging, code optimization, database design, and exploratory data analysis using Tableau while validating AI-generated outputs.
Communicate analytical findings through effective data visualization, dashboards, and business storytelling tailored to different audiences.
Build a portfolio of hands-on assignments, SQL solutions, Python applications, Tableau dashboards, and course-end project that demonstrate practical technical and analytical skills.
Develop a strong foundation for internships, higher education, and entry-level roles in data analytics, programming, business intelligence, and other technology-driven careers through project-based learning and practical skill validation.
Industry-Recognized Certification
Certificate of Completion
This is to certify that
Has successfully completed the Data Analysis Applied Program
Signature
Date
Earn a trusted NIIT professional certificate.
Global Recognition
Accepted by leading employers and organizations worldwide.
Easy Sharing
Add your certificate to LinkedIn, resumes, and professional portfolios.
Career Value
Demonstrates practical skills aligned with industry needs.
Data-Driven Learning, Delivered with Quality
Experience a data-driven learning ecosystem with measurable progress.
Structured Learning Roadmap
Clear learning pathways delivered through our LMS with defined milestones and module progression.
Learner Connect Sessions
Regular live mentor interactions to resolve doubts, reinforce concepts, and maintain engagement.
AI Assisted Faculty Quality Monitoring
AI-assisted faculty performance analysis ensures consistent teaching quality and delivery excellence.
Program Performance Report
Track attendance, assignments, assessments, quizzes, and overall performance with structured progress tracking.
Applied Case Studies
Strengthen learning through business-focused case studies that help apply concepts to real-world scenarios.
Advanced Visual Analytics
Apply time-series, spatial, relational, distribution, trend, correlation, LOD, and table calculation techniques.
Frequently Asked Questions
Find answers to your queries about the program, curriculum, and admissions.
This program is designed for Class X and Class XII students, undergraduate students from any discipline, beginners, aspiring technology enthusiasts, and working professionals looking to build practical skills in SQL, Python programming, data management, and data visualization.
Learners should have basic familiarity with computers and internet usage. No prior programming experience is required, making the program suitable for beginners seeking to develop foundational digital and analytical skills.
The program comprises 128 hours of learning, including a 36-hour self-paced Tableau course, delivered over approximately 6 weeks through a sprint-based learning model.
Each sprint is 4 hours, comprising 2 hours of live, mentor-led sessions or self-paced learning, followed by 2 hours of self-guided, hands-on practice.
Learners are also expected to dedicate additional time outside scheduled sessions to complete projects and assignments, depending on the program requirements.
No. Prior programming or analytics experience is not required. The program is designed for beginners and learners from any academic background. SQL, Python programming, and Tableau are introduced from the fundamentals through step-by-step guided learning. Learners only need basic computer literacy, logical thinking, and a willingness to learn.
No. The program focuses on building strong foundations in SQL, Python programming, database management, and data visualization using Tableau. It prepares learners with the core technical skills required before progressing to specialized areas such as Machine Learning, Deep Learning, or Data Science.
Admission to the program is direct. Eligible learners can apply by completing the online application form, submitting the self-declaration, accepting the terms and conditions, and paying the program fee. Admission is confirmed upon successful payment.
The program is designed using NIIT’s Mastery Learning methodology, underpinned by LPARR (Learn, Practice, Apply, Review & Refactor), NIIT’s proprietary instructional design framework rooted in proven Learning Sciences principles. Learners build proficiency progressively, mastering one skill at a time through structured learning sprints that combine conceptual understanding with practical application.
The learning journey integrates live mentor-led instruction, self-paced learning modules, guided hands-on practice, assignments, real-world case studies, mentor review and feedback, and refinement through re-submission. This approach ensures that learners not only understand key concepts but also develop the confidence to apply them effectively in practical scenarios.
Each learning sprint is designed to take approximately 4 hours, comprising:
In addition to the mentor-led learning experience, the program includes a 36-hour self-paced Tableau course that enables learners to build industry-relevant data visualization, dashboarding, and business reporting skills at their own pace.
Through continuous practice, review, and refinement, learners develop both technical proficiency and problem-solving capabilities required for real-world data and business analytics projects.
The program helps learners build a strong foundation for:
Yes. Learners complete mentor-led and course-end projects, along with a Tableau business case study based on realistic business scenarios. Throughout the program, they build a portfolio of SQL scripts, dashboards, and analytical solutions that demonstrate practical skills and readiness for future academic and professional opportunities.
Yes, individual topics are available through free online resources. However, learners often find it difficult to identify what to learn, practice consistently, and connect concepts across different tools. This program provides a structured learning path, mentor guidance, hands-on projects, continuous feedback, and an integrated curriculum that builds skills progressively.
Knowing basic programming is only one part of becoming data-ready. This program teaches how to apply SQL, Python, and Tableau together to manage databases, analyze data, create dashboards, and solve practical business problems using modern AI-assisted workflows.
Learners use modern AI-assisted development and analytics tools including ChatGPT, Gemini, GitHub Copilot, AI-powered SQL assistants, and other AI tools integrated throughout the program. These tools support SQL query generation, Python coding, debugging, code optimization, database design, data exploration, and visualization. Learners also develop the ability to validate AI-generated outputs and apply them responsibly in practical projects.
Yes. The program is designed for beginners and follows a structured, mentor-guided approach. Each topic builds progressively through demonstrations, guided practice, assignments, and projects. The self-paced Tableau course also gives learners the flexibility to learn according to their own schedule.
You need a laptop with stable internet connectivity. The program uses:
You need at least 8 GB RAM, an Intel i3 or AMD Ryzen 5 (8th gen or newer) processor, a 256 GB SSD with 50 GB free space, 10 Mbps+ internet, and a webcam with audio for live sessions. No GPU is required, and the setup runs on Windows 10, macOS 11, or Ubuntu 20.04.
Yes, learners receive a digital certificate after successfully completing the program and meeting all the required conditions (overall performance score, attendance, payment clearance etc).
Hassle-Free Refund Policy
Your satisfaction is our priority. We offer transparent refund terms for your peace of mind.
100% Money-Back Guarantee
Full refund (excluding the booking fee) if you cancel before the batch starts
Quick Refund Review
Eligible refund requests are carefully reviewed within seven working days
Transparent Refund Timeline
Approved refunds are completed within 45 days for timely settlement
Important: Enjoy a transparent refund policy. Cancel 48 hours before the class start date to be eligible for a refund if you haven’t attended any class.
Tell us your preferred slot
Custom Schedule Assistance
Investment Plan
Secure your future today
Exclusive of 18% GST
Secure your seat with a token booking fee of ₹1,500 today.
Exclusive of 18% GST