


Advanced Excel Applied Program
Master Advanced Excel, Data Analytics, AI Tools, Dashboards and Data Storytelling with NIIT’s program. Learn Excel formulas, PivotTables, data visualization, statistics and AI-assisted workflows to analyze data, build dashboards and make smarter business decisions every day.
Program Overview
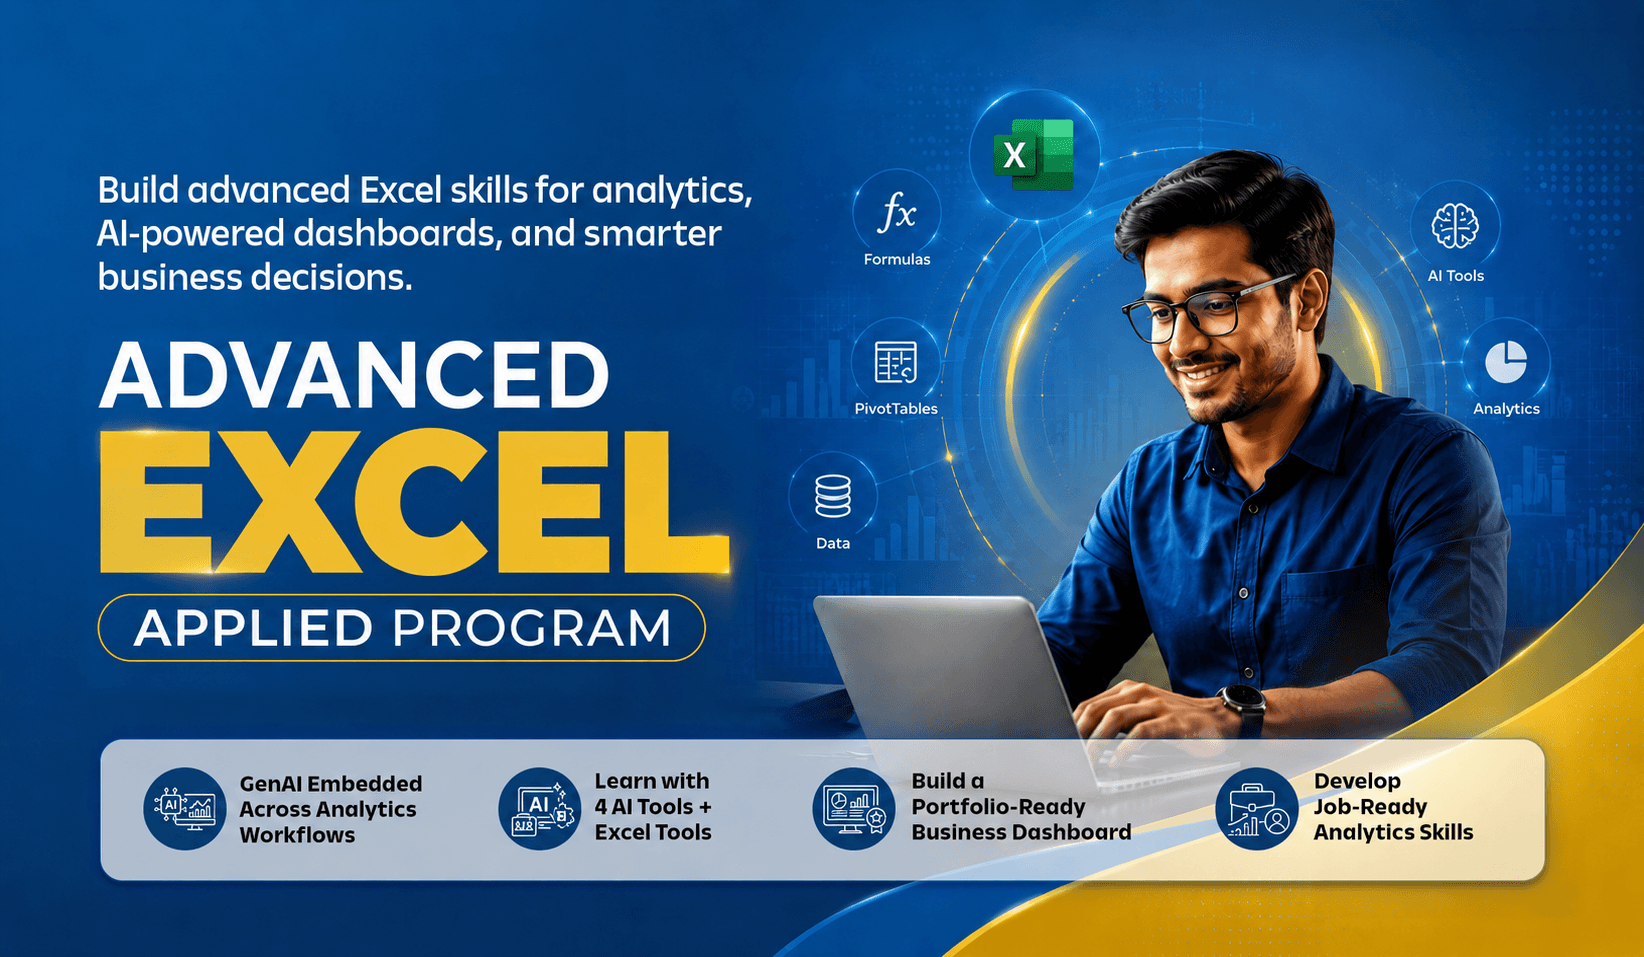
Advanced Excel Applied Program by NIIT develops Excel analytics and AI data skills. They build expertise across the workflow: Prepare, Analyze, Visualize, Communicate and Recommend. It covers Excel fundamentals, formulas, data preparation, PivotTables, statistics, outlier detection, visualization, dashboards and data storytelling. AI-Augmented Excel Productivity using ChatGPT, Formula Bot, Microsoft Copilot and Claude accelerates formula generation, data cleaning, chart selection, insight generation and dashboard narration while learners critically validate AI outputs. Through exercises and a course-end project, learners analyze data, build dashboards and communicate insights.
Curriculum
Comprehensive curriculum to build in-demand tech skills and real-world expertise.
Excel Fundamentals & Data Preparation
Explore data categories and types, apply XLOOKUP, SUMIFS, COUNTIFS, AVERAGEIFS, and MAXIFS, import data from multiple sources, clean and transform datasets, and automate formula generation and data preparation using GenAI tools.
Data Summarization & Pivot Analysis
Organize and summarize data with PivotTables and PivotCharts, apply sorting, filtering, grouping, and slicers for interactive analysis, and generate actionable insights using AI-assisted analytics tools.
Data Visualization
Create effective charts including bar, column, line, pie, scatter, histogram, box plot, and line charts; select appropriate visualizations for different business scenarios; generate AI-assisted charts and automated visual insights.
Descriptive Statistics & Data Exploration
Measure central tendency using mean, median, and mode; analyze data spread using range, IQR, variance, standard deviation, and skewness; measure relationships using Pearson correlation; and generate statistical summaries and interpretations with GenAI.
Outlier Detection & Data Quality
Detect and interpret outliers using statistical methods; apply IQR and z-score–based outlier treatments; and improve data quality using AI-assisted data validation and preprocessing.
Data Storytelling & Business Communication
Combine data, visuals, and narratives to communicate insights; perform KPI driven analysis; develop compelling business stories supported by data; and generate AI-assisted narratives and executive summaries.
Dashboard Design & Reporting
Design interactive Excel dashboards using PivotTables, charts, and slicers; present KPIs and business metrics effectively; and build AI-assisted dashboards and decision-ready reports using ChatGPT and other GenAI tools.
Complete a two-phase course-end project, demonstrate learning through a course-end assessment, and present the final project across two sprints to showcase end-to-end analytics and business problem-solving competency.
Tools & Technologies
Explore industry-relevant tools through hands-on learning to master practical, in-demand skills.
Projects You'll Build
Build production-ready projects to showcase real-world skills and strengthen your portfolio.
Business Data Storytelling & Dashboard
Analyze real-world datasets using Excel to clean, summarize, visualize, and communicate business insights through interactive dashboards, delivering a data analysis report, executive presentation, and portfolio-ready solution using industry-relevant scenarios.
Boost Your Career Visibility
Showcasing a professional Capstone Project on your LinkedIn increases recruiter interest significantly. Build production-ready work that speaks for itself.
Learning Outcomes
Develop industry-relevant skills to create real-world solutions and advance your career.
Transform raw, structured, and semi-structured data into actionable insights using Microsoft Excel, descriptive statistical techniques, and AI-assisted analytics.
Apply the complete Excel analytics workflow encompassing data preparation, analysis, visualization, communication, and recommendation to solve real-world business challenges.
Clean, organize, and transform datasets using Excel functions, data preparation techniques, and AI-assisted tools to create analysis-ready data.
Analyze and summarize data using advanced Excel functions, PivotTables, PivotCharts, descriptive statistics, correlation analysis, and outlier detection to uncover meaningful business insights.
Create interactive charts, dashboards, and compelling data stories using Excel visualization techniques and best practices for business communication.
Leverage AI tools to accelerate ormula generation, data cleaning, chart selection, statistical summaries, dashboard development, and business storytelling while critically validating AI-generated outputs.
Communicate analytical findings through interactive Excel dashboards, executive presentations, AI-generated business narratives, and actionable recommendations tailored to business stakeholders.
Deliver a portfolio-ready analytics solution through a course-end project integrating data preparation, statistical analysis, visualization, dashboard design, and business storytelling.
Industry-Recognized Certification
Certificate of Completion
This is to certify that
Has successfully completed the Advanced Excel Applied Program
Signature
Date
Earn a trusted NIIT professional certificate.
Global Recognition
Accepted by leading employers and organizations worldwide.
Easy Sharing
Add your certificate to LinkedIn, resumes, and professional portfolios.
Career Value
Demonstrates practical skills aligned with industry needs.
Data-Driven Learning, Delivered with Quality
Experience a data-driven learning ecosystem with measurable progress.
Structured Learning Roadmap
Clear learning pathways delivered through our LMS with defined milestones and module progression.
Learner Connect Sessions
Regular live mentor interactions to resolve doubts, reinforce concepts, and maintain engagement.
AI Assisted Faculty Quality Monitoring
AI-assisted faculty performance analysis ensures consistent teaching quality and delivery excellence.
Program Performance Report
Track attendance, assignments, assessments, quizzes, and overall performance with structured progress tracking.
Frequently Asked Questions
Find answers to your queries about the program, curriculum, and admissions.
This program is designed for students from Standard VI onwards, higher secondary and undergraduate students from any discipline, freshers, aspiring professionals, working professionals, entrepreneurs, educators, and business users looking to build practical skills in Excel, data analysis, visualization, dashboard creation, and business reporting.
Learners should have basic computer literacy, including familiarity with a keyboard, mouse, and Windows operating system. No prior knowledge of programming, statistics, or data analytics is required. Applicants may be required to complete a basic aptitude and English assessment as part of the admission or orientation process.
The program comprises 60 hours of learning delivered over approximately 4 weeks, following a sprint-based learning model.
Each sprint is 4 hours, comprising 2 hours of live, mentor-led sessions and 2 hours of self-guided, hands-on practice.
Learners are also expected to dedicate additional time outside scheduled sessions to complete projects and assignments, depending on the program requirements.
No. Prior programming or analytics experience is not required. The program is designed for learners from any academic background. Learners should have basic proficiency in Microsoft Excel, while advanced Excel analytics concepts are introduced through structured, hands-on learning.
Admission to the program is direct. Eligible learners can apply by completing the online application form, submitting the self-declaration, accepting the terms and conditions, and paying the program fee. Admission is confirmed upon successful payment.
The program follows NIIT’s Mastery Learning methodology, built around NIIT’s unique instructional design pedagogical construct LPARR – Learn, Practice, Apply, Review & Refactor, one of the leading Learning Sciences constructs. Learners build one skill at a time through structured, hands-on sprints, with live mentor sessions, individual practice, assignments, mentor review and feedback, and refinement through re-submission. Each sprint typically takes around 4 hours, with most of the time focused on hands-on application and reflection.
Yes. Learners complete a Business Data Storytelling Dashboard project using a real-world dataset. The project integrates data preparation, analysis, visualization, dashboard development, and business storytelling to build a portfolio-ready deliverable.
You need a laptop with stable internet connectivity. The program uses:
You need at least 8 GB RAM, an Intel i3 or AMD Ryzen 5 (8th gen or newer) processor, a 256 GB SSD with 50 GB free space, 10 Mbps+ internet, and a webcam with audio for live sessions. No GPU is required, and the setup runs on Windows 10, macOS 11, or Ubuntu 20.04.
The program goes beyond basic spreadsheet skills by covering advanced Excel functions, data cleaning, PivotTables, statistical analysis, interactive dashboards, data storytelling, and AI-assisted analytics used in modern workplaces.
Learners use ChatGPT, Microsoft Copilot, Formula Bot, and Claude to accelerate formula generation, data cleaning, chart creation, dashboard development, business storytelling, and insight generation while learning to validate AI-generated outputs.
Yes, learners receive a digital certificate after successfully completing the program and meeting all the required conditions (overall performance score, attendance, payment clearance etc).
Hassle-Free Refund Policy
Your satisfaction is our priority. We offer transparent refund terms for your peace of mind.
100% Money-Back Guarantee
Full refund (excluding the booking fee) if you cancel before the batch starts
Quick Refund Review
Eligible refund requests are carefully reviewed within seven working days
Transparent Refund Timeline
Approved refunds are completed within 45 days for timely settlement
Important: Enjoy a transparent refund policy. Cancel 48 hours before the class start date to be eligible for a refund if you haven’t attended any class.
Tell us your preferred slot
Custom Schedule Assistance
Investment Plan
Secure your future today
Exclusive of 18% GST
Secure your seat with a token booking fee of ₹1,500 today.
Exclusive of 18% GST