


AI Data Analytics Professional Program
Become an AI-augmented data analyst with analytical thinking, AI-powered productivity, and business intelligence expertise.
Program Overview
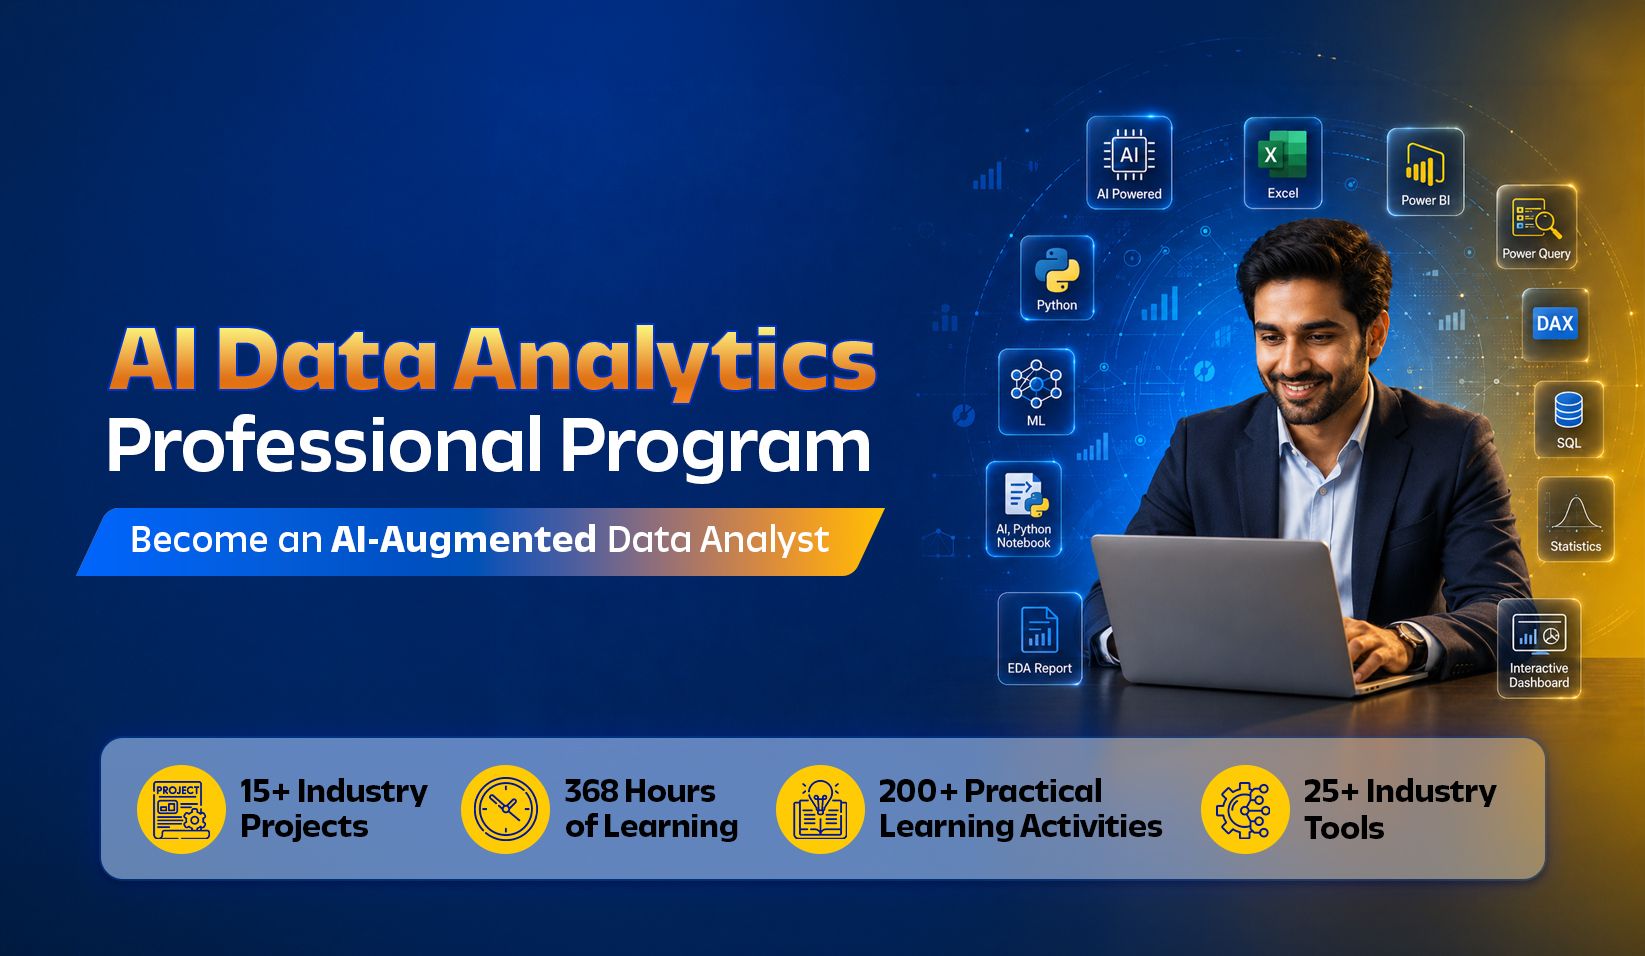
The AI Data Analytics Professional Program by NIIT develops AI-augmented analysts who combine strong analytical thinking with AI-assisted productivity. Through live instruction, guided hands-on practice, course-end projects, a capstone project, learners progress from foundational knowledge to job-ready competencies aligned with modern Data Analyst roles. They build capabilities in AI-assisted data preparation, querying and analysis; AI-augmented business intelligence and storytelling; statistical analysis and predictive analytics; and LLM-assisted workflows for coding, validation, insight generation and data-driven decision-making.
Curriculum
Comprehensive curriculum to build in-demand tech skills and real-world expertise.
Excel Fundamentals & Data Preparation
Explore data categories and types, apply XLOOKUP, SUMIFS, COUNTIFS, AVERAGEIFS, and MAXIFS, import data from multiple sources, clean and transform datasets, and automate formula generation and data preparation using GenAI tools.
Data Summarization & Pivot Analysis
Organize and summarize data with PivotTables and PivotCharts, apply sorting, filtering, grouping, and slicers for interactive analysis, and generate actionable insights using AI-assisted analytics tools.
Data Visualization
Create effective charts including bar, column, line, pie, scatter, histogram, box plot, and line charts; select appropriate visualizations for different business scenarios; generate AI-assisted charts and automated visual insights.
Descriptive Statistics & Data Exploration
Measure central tendency using mean, median, and mode; analyze data spread using range, IQR, variance, standard deviation, and skewness; measure relationships using Pearson correlation; and generate statistical summaries and interpretations with GenAI.
Outlier Detection & Data Quality
Detect and interpret outliers using statistical methods; apply IQR and z-score–based outlier treatments; and improve data quality using AI-assisted data validation and preprocessing.
Data Storytelling & Business Communication
Combine data, visuals, and narratives to communicate insights; perform KPI driven analysis; develop compelling business stories supported by data; and generate AI-assisted narratives and executive summaries.
Dashboard Design & Reporting
Design interactive Excel dashboards using PivotTables, charts, and slicers; present KPIs and business metrics effectively; and build AI-assisted dashboards and decision-ready reports using ChatGPT and other GenAI tools.
Complete a two-phase course-end project, demonstrate learning through a course-end assessment, and present the final project across two sprints to showcase end-to-end analytics and business problem-solving competency.
Data Extraction & Power Query
Extract data from Excel, CSV, TXT, PDF, databases, and web sources; apply ETL (Extract, Transform, Load) techniques using Power Query; clean, transform, standardize, and prepare data for analysis; and automate data preparation using AI-assisted workflows.
Data Modeling
Design efficient data models using Star and Snowflake schemas; build relationships, hierarchies, and date tables; apply merge, append, pivot, and unpivot operations; and optimize models for performance, scalability, and data quality.
DAX for Business Analytics
Create calculated columns and measures using DAX; apply aggregation, filtering, and relationship functions; build advanced business calculations; and generate and validate DAX formulas using AI assistants.
Data Visualization & Storytelling
Create impactful charts and interactive visualizations; design KPI-focused reports and business dashboards; apply data storytelling techniques to communicate insights; and generate AI-assisted narratives and business summaries.
Interactive Dashboards & Reporting
Build interactive dashboards using slicers, filters, drill-through, bookmarks, and mobile layouts; design executive-ready reports for business stakeholders; and publish, share, and manage Power BI reports securely.
AI-Powered Business Intelligence
Leverage analytics and Power BI AI capabilities; use Copilot and GenAI tools for DAX, dashboards, and insight discovery; apply AI-generated narratives, anomaly detection, and key influencer analysis; accelerate AI-assisted decision-making.
Advanced Business Analytics
Define and monitor business KPIs; analyze trends, customer behavior, and business performance; and develop decision-ready insights for business stakeholders.
Complete a two-phase course-end project, demonstrate learning through a course-end assessment, and present the final project across two sprints to showcase end-to-end analytics and business problem-solving competency.
Relational Databases & SQL Fundamentals
Understand relational database concepts, tables, keys, and relationships; set up MySQL; retrieve data using SQL queries with filtering, sorting, grouping, and aggregation; and apply built-in SQL functions with AI-assisted query generation.
Data Retrieval & SQL Analytics
Write SQL queries using SELECT, WHERE, GROUP BY, HAVING, ORDER BY, and CASE; apply string, date, and aggregate functions; generate analytical reports and summaries; and debug and optimize queries using AI assistants.
Multi-Table Queries & Advanced SQL
Combine data using INNER, LEFT, RIGHT, CROSS, and SELF JOINs; apply UNION, Common Table Expressions (CTEs), subqueries, and window functions; solve analytical problems; and generate AI-assisted SQL queries and solutions.
Database Design & Schema Management
Design Entity-Relationship (ER) diagrams; apply normalization (1NF, 2NF, and 3NF) to create efficient database structures; create and manage database objects using DDL commands; and validate schemas using AI-assisted tools.
Data Management & Database Programming
Insert, update, delete, and clean data using DML; create views, indexes, stored procedures, user-defined functions, and triggers; automate database operations; and optimize SQL code using AI-assisted recommendations.
Database Security & Transaction Management
Apply transaction management using COMMIT, ROLLBACK, and SAVEPOINT; understand ACID properties and database locking; manage database security using roles, permissions, and DCL commands; and ensure data consistency.
SQL Analytics & AI-Augmented Workflows
Handle semi-structured JSON data using SQL; build SQL-based ETL workflows and reporting pipelines; automate SQL generation, optimization, debugging, and documentation using GenAI tools; and develop AI-assisted analytics workflows.
Complete a two-phase course-end project, demonstrate learning through a course-end assessment, and present the final project across two sprints to showcase end-to-end analytics and business problem-solving competency.
Python Programming Fundamentals
Understand Python syntax, variables, data types, and operators; write programs using input, output, expressions, and type conversions; develop logical problem-solving skills through programming exercises and practical coding tasks.
Decision Making & Iterative Programming
Implement decision-making using if, elif, and else statements; build iterative programs using for and while loops; apply nested loops and loop control statements to solve business problems efficiently and accurately.
Functions & Modular Programming
Create reusable programs using user-defined functions; work with parameters, return values, local and global variables; apply modules and lambda functions to build modular, reusable, and efficient Python applications.
Data Structures & Data Manipulation
Manipulate strings using indexing and slicing; store and organize data using lists, tuples, sets, and dictionaries; perform searching, updating, sorting, aggregation, and data retrieval operations efficiently in Python.
Object-Oriented Programming (OOP)
Build applications using classes and objects; implement constructors, instance variables, class variables, and methods; apply object-oriented principles to create structured, reusable, and maintainable Python programs.
Exception Handling & File Operations
Handle runtime errors using exception handling techniques; read, write, append, and manage files using Python; build robust programs with effective error handling and reliable file management for business applications.
AI-Assisted Python Development
Use Colab Gemini for code generation and debugging; generate Python code with GitHub Copilot in Visual Studio Code; and interpret errors, optimize code, and improve productivity with AI-assisted workflows.
Concept Quiz and Assignments
Data Preparation with NumPy & Pandas
Prepare and structure data using NumPy arrays, Pandas Series, and DataFrames; combine, merge, reshape, and summarize datasets; and handle missing values, duplicates, and inconsistent data for accurate business analysis.
Data Wrangling & Data Management
Perform CRUD operations on DataFrames; clean, transform, and prepare data for analysis; create derived features; and optimize datasets for analytics using efficient data wrangling and management techniques.
Data Visualization
Create effective visualizations using Matplotlib, Seaborn, and Plotly; select appropriate charts to explore trends, distributions, and relationships; and develop visuals that communicate business insights effectively.
Descriptive Statistics & Data Analysis
Apply descriptive statistical techniques including measures of central tendency, dispersion, skewness, kurtosis, and correlation; summarize datasets; and generate statistical insights to support business decisions.
Python & SQL Integration
Connect Python applications to relational databases; retrieve, manipulate, and analyze SQL data using Python; and build integrated analytics workflows by combining SQL queries with Python-based data processing.
Exploratory Data Analysis (EDA)
Perform structured univariate, bivariate, and multivariate analysis; identify patterns, trends, correlations, and anomalies; and apply best practices to conduct systematic exploratory data analysis for business insights.
AI-Assisted Exploratory Analytics
Accelerate exploratory data analysis using AI-powered profiling and visualization tools; generate AI-assisted code, visualizations, and insights; and validate outputs for reliable business analytics workflows.
Complete a two-phase course-end project, demonstrate learning through a course-end assessment, and present the final project across two sprints to showcase end-to-end analytics and business problem-solving competency.
Probability & Statistical Thinking
Apply probability concepts to solve real-world business problems; understand simple, joint, and conditional probability, permutations, and combinations; and apply Bayesian thinking for data-driven reasoning and decision-making.
Sampling & Data Distribution
Apply sampling techniques including simple random, stratified, systematic, and cluster sampling; understand normal distribution and the Central Limit Theorem; and interpret sampling distributions to assess data reliability.
Inferential Statistics & Hypothesis Testing
Formulate null and alternative hypotheses; perform Z-tests and T-tests to validate business assumptions; interpret p-values, confidence levels, and statistical significance; and apply AI-assisted statistical interpretation for decisions.
Regression & Predictive Analytics
Build and interpret simple linear regression models; analyze relationships between variables using regression techniques; and apply regression for prediction, forecasting, and data-driven business decision-making.
Business Analytics with Statistics
Prepare analytical datasets for predictive modelling; create statistical visualizations and communicate analytical findings; and interpret statistical outputs to generate actionable business insights for informed decision-making.
AI-Assisted Statistical Analysis
Leverage GenAI tools to interpret statistical results and explain analytical findings; validate AI-generated statistical interpretations using analytical reasoning; and improve decision-making through AI-assisted statistical analysis.
Concept Quiz and Assignments
Prompt Engineering for Analytics
Design effective prompts for data preparation, analysis, visualization, and reporting; apply prompt engineering to improve AI output quality and accuracy; and automate common analytics tasks and workflows using Generative AI.
AI Validation & Responsible AI
Critically evaluate AI-generated code, analyses, and business insights; validate outputs using analytical reasoning and domain knowledge; and apply responsible AI practices including bias awareness, transparency, and human oversight.
Experimentation & Behavioral Analytics
Apply A/B testing concepts to compare business outcomes; perform funnel and cohort analysis to understand customer behavior and retention; and interpret experimentation results to support data-driven business decisions.
LLM Integration & AI-Augmented Analytics
Integrate Gemini API with Python applications for AI-assisted analytics; automate coding, data analysis, visualization, and insight generation using LLMs; and develop AI-augmented analytics workflows with executive-ready business narratives.
Concept Quiz and Assignments
Business Problem Definition & Project Planning
Identify and define real-world business problems; establish analytical objectives, business questions, and hypotheses; select an industry-focused capstone project; and plan an end-to-end analytics approach for execution.
Data Preparation & Analytics Foundation
Acquire, clean, transform, and organize business datasets; apply version control and structured data management practices; and prepare analysis-ready datasets using AI-assisted workflows for reliable business analytics.
End-to-End Data Analysis
Perform analysis using Excel, SQL, Python, and Power BI; conduct exploratory data analysis, KPI analysis, and descriptive analytics; and integrate insights from multiple analytics tools into a unified business solution.
Statistical Validation & Predictive Analytics
Apply hypothesis testing to validate business assumptions; build and interpret simple linear regression models; and evaluate analytical findings using statistical evidence and business reasoning for confident decisions.
Dashboard Development & Business Storytelling
Develop interactive dashboards and executive reports; communicate analytical findings through effective data storytelling; and present actionable recommendations using business-focused visualizations for informed decision-making.
AI-Augmented Analytics Workflow
Leverage ChatGPT, Gemini, GitHub Copilot, YData Profiling, Sweetviz, and AutoViz to accelerate analytics; validate AI outputs using analytical reasoning; and apply responsible AI throughout the analytics lifecycle.
Executive Communication & Project Showcase
Prepare professional project documentation and executive presentations; defend analytical methodology, findings, and recommendations during the capstone showcase; and demonstrate end-to-end analytics competency through a portfolio project.
Project Presentation & Stakeholder Evaluation
Present and demonstrate the end-to-end project workflow, outcomes, and key learnings to stakeholders for assessment of functional completeness, integration depth, and design quality.
Solve a real business problem using Excel, SQL, Python, Power BI, Statistics & AI. Create dashboards, EDA, KPI frameworks, regression reports, business recommendations, and a professional analytics portfolio demonstrating end-to-end data skills.
Tools & Technologies
Explore industry-relevant tools through hands-on learning to master practical, in-demand skills.



Projects You'll Build
Build production-ready projects to showcase real-world skills and strengthen your portfolio.
Business Data Storytelling Dashboard
Analyze real-world datasets using Excel to clean, summarize, visualize, and communicate business insights through interactive dashboards, delivering a data analysis report, executive presentation, and portfolio-ready solution using industry-relevant scenarios.
Executive Business Intelligence Dashboard
Develop interactive business intelligence dashboards using Power BI, Power Query, DAX, and AI-powered capabilities to support executive decision-making, delivering interactive Power BI dashboards, KPI frameworks, AI-generated narratives, and executive business presentations.
Relational Database Design & Business Intelligence System
Design, implement, and query relational databases to solve business problems, automate reporting, and generate actionable insights, delivering a database schema, SQL scripts, SQL query portfolio, and project presentation.
AI-Assisted Exploratory Data Analysis Project
Acquire, clean, transform, analyze, and visualize real-world datasets using Python and AI-assisted workflows to discover insights and build interactive analytical solutions, delivering a Python notebook, EDA report, interactive dashboard, AI-assisted insight summary, and project presentation.
Capstone – Build an End-to-End AI-Augmented Analytics Solution
Solve end-to-end AI-augmented analytics consulting engagement using Excel, SQL, Python, Power BI, and Statistics. Deliver business problem statement, cleaned dataset, dashboards, EDA report, SQL portfolio, statistical validation, final report, executive presentation, and actionable recommendations.
Boost Your Career Visibility
Showcasing a professional Capstone Project on your LinkedIn increases recruiter interest significantly. Build production-ready work that speaks for itself.
Learning Outcomes
Develop industry-relevant skills to create real-world solutions and advance your career.
Transform raw, structured, and semi-structured data into actionable business insights using Excel, SQL, Python, Power BI, statistical techniques, and prompt engineering.
Apply the complete analytics lifecycle from data preparation to business recommendations to solve real-world problems.
Design data preparation, exploratory analysis, and reporting workflows using Python, analytics libraries, and AI tools.
Extract, manage, and analyze relational database data using SQL to answer business and operational questions.
Build interactive dashboards and executive reports using Power BI, DAX, data modeling, and visualization best practices.
Apply statistical reasoning, hypothesis testing, regression analysis, and experimentation techniques to support evidence-based decision-making.
Combine analytics, prompt engineering, AI validation, experimentation, and LLM workflows to solve business problems.
Leverage Generative AI and copilots to accelerate data cleaning, coding, querying, analysis, visualization, and insights.
Communicate analytical findings through business storytelling, stakeholder presentations, and actionable recommendations.
Deliver an end-to-end analytics solution through a portfolio-ready capstone integrating analysis and communication.
Demonstrate readiness for analytics roles through hands-on projects, business cases, portfolio development, and assessments.
Industry Salary Growth
Accelerate your career with strong salary growth across India.
Select Experience Level

Salary Growth
Annual PackagesCurrently Hiring Companies for this role






Industry-Recognized Certification
Certificate of Completion
This is to certify that
Has successfully completed the AI Data Analytics Professional Program
Signature
Date
Earn a trusted NIIT professional certificate.
Global Recognition
Accepted by leading employers and organizations worldwide.
Easy Sharing
Add your certificate to LinkedIn, resumes, and professional portfolios.
Career Value
Demonstrates practical skills aligned with industry needs.
Placement Assistance
Dedicated placement support with industry connections and recruiter interactions.
Placement Assistance Policy
Dedicated placement assistance with leading industry hiring partners. Refer to the FAQ and T&C sections for placement eligibility details.
Our Hiring Network
800+ Top Recruiting Companies


Data-Driven Learning, Delivered with Quality
Experience a data-driven learning ecosystem with measurable progress.
Structured Learning Roadmap
Clear learning pathways delivered through our LMS with defined milestones and module progression.
Learner Connect Sessions
Regular live mentor interactions to resolve doubts, reinforce concepts, and maintain engagement.
AI Assisted Faculty Quality Monitoring
AI-assisted faculty performance analysis ensures consistent teaching quality and delivery excellence.
Program Performance Report
Track attendance, assignments, assessments, quizzes, and overall performance with structured progress tracking.
Meet Your Mentors
Learn from Industry Experts and Experienced Professionals.

Rohit Kumar
Senior Mentor
Rohit Kumar is a Senior Mentor at NIIT with over 13 years of experience in Data Science, Machine Learning, Python, and Full Stack Development. He is known for making complex topics easy to understand and apply in real-world scenarios. His expertise spans across Full Stack Development, Data Analytics, Machine Learning, Big Data, Cloud Computing, Blockchain, and AI-driven applications and he holds multiple globally recognized certifications. He is also an Enterprise Design Thinking Practitioner and a published researcher in image encryption and security algorithms, reflecting his strong analytical and problem-solving skills. Through hands-on projects, real-world datasets, and continuous guidance, he helps learners build confidence and become job-ready technology professionals.

Komilla Bhatia
Senior Mentor
Komilla Bhatia is a Senior Data Science mentor at NIIT with nearly 20 years of experience in transforming learners into confident, industry-ready professionals. Renowned for her deep expertise in Data Analytics, Machine Learning, Deep Learning, NLP, Large Language Models, and Generative AI, she has delivered over 40,000 hours of impactful learning to thousands of learners across India. Known for her ability to simplify complex concepts, Komilla blends strong technical mastery with a highly engaging teaching approach, empowering learners not just to be skilled, but to pursue their careers with purpose, confidence, and long-term impact
Success Stories
Hear from our graduates about their transformative journey with NIIT.

Jayesh Sharma
Data Analyst @ PragMath
"I am truly grateful to NIIT and StackRoute for the opportunity to be part of the Data Science and ML with GenAI – Advanced Program. The curriculum was well-structured, combining strong theoretical foundations with hands-on learning in data science, machine learning, and generative AI. The guidance from experienced mentors played a key role in building my technical and problem-solving skills. I’m happy to share that, thanks to this training, I have secured a position as a Data Analyst at PragMath. A heartfelt thank you to the entire NIIT team for their constant support and for being an essential part of my journey."

Bijayashanti Shukla
"This course is designed in such a way that there is daily practice, hackathons and several projects which was very helpful during my interview. The mentors are very supportive, patient and cooperative with us and helped us a lot to over come all the challenges. Initially I had my doubts regarding this course, but now I can say that I made the right decision. Also the placement team service was very good. There are several grooming sessions, aptitude sessions, mock interviews for us to prepare ourselves for interviews. They provided enough motivation and helped me to be placed in good organization."

Reddipalli Yaswanth Sai
"The course was conducted online by fabulous tutors, and the program structure was excellent. It was designed with the right balance of challenges, and the mentors were always there to guide us through them. Shraddha Ma’am was a constant source of inspiration and support, helping me secure a great placement package."

Veera Venkata Ramakrishna
“I would like to thank NIIT for providing me with a platform to upskill myself. My six months of learning at NIIT were truly memorable — full of learning, personal growth, and self-development. The experience gave me the opportunity to meet diverse people and learn from them. I’m deeply grateful to all my mentors and the placement team for helping me enhance my skills and secure a position in a reputed company.”

Sakshi Singaraddi
Trainee software engineer @ Techneplus
"NIIT provided an excellent platform to develop new technical skills. The mentors were friendlyand supportive, helping me overcome - I faced no difficulties completing the course. The NIIT placement team guided me extensively, provided crucial support to clear the interview process, and offered grooming sessions that built my confidence. I'm deeply grateful to my mentor and the entire placement team. Thank you NIIT!!"
Frequently Asked Questions
Find answers to your queries about the program, curriculum, and admissions.
Candidates with a minimum of 50% in Class X, XII, and graduation are eligible to apply. Undergraduates must maintain at least 50% marks through their final year and secure a minimum 50% aggregate upon graduation.
Final-year undergraduate students and recent graduates (BE/BTech, BCA, BSc, BBA, BCom, BA, or equivalent) seeking job-ready skills in analytics, business intelligence, and AI.
Postgraduate students (MTech, MCA, MSc, MBA, MA, MS, or equivalent) looking to complement their academic qualifications with practical analytics, AI, and business intelligence expertise.
Working professionals in operations, MIS, reporting, finance, marketing, customer support, or related functions aiming to transition into analytics, business intelligence, data science, or AI roles.
Career switchers and aspiring data professionals looking to build industry-relevant analytics and AI skills through hands-on projects and real-world business use cases.
Applicants should have studied Mathematics up to Class X (or equivalent).
Students without a Mathematics background are required to take an aptitude and English test during orientation.
Admission to the program is direct. Eligible learners can apply by filling out the online application form, submitting the self-declaration and accepting the terms and conditions, and paying the program fee. Admission is confirmed once the payment is successfully completed.
Students without a Mathematics background are required to take an aptitude and English test during orientation.
No, prior programming or analytics experience is not required. The program is designed for learners from any academic background, with Python and SQL introduced from scratch through step-by-step guided practice. Learners only need basic mathematical aptitude and a willingness to learn.
Excel alone typically isn't enough for most analytics roles, which increasingly require SQL, Python, business intelligence tools, and statistical analysis. This program builds skills across Excel, SQL, Python, Power BI, and applied statistics, enabling learners to query, analyze, visualize, validate, and communicate business data using a broader analytics toolkit.
Yes, individual analytics skills can be learned from free resources, but learners must typically build their own learning sequence, practice pathway, and feedback loop on their own. This program provides that structure directly: a guided learning path, mentor-led sessions, continuous assignment feedback, and an 11-phase capstone project that applies skills in an integrated business context.
The program runs for approximately 23 weeks and requires an average commitment of 16 hours per week.
Learning is delivered through structured 4-hour sprints: each sprint consists of 2 hours of mentor-led instruction followed by 2 hours of guided hands-on practice. The weekly commitment also includes assignments, project work, and assessments completed between sprints to reinforce concepts and progressively build analytics and AI-augmented analytics skills.
The program is primarily focused on Data Analytics, Business Intelligence, Applied Statistics, and AI-Augmented Analytics. Learners develop the skills required to prepare, analyze, visualize, validate, and communicate data-driven insights using modern analytics tools and AI-assisted workflows.
The curriculum includes foundational predictive analytics concepts through Simple Linear Regression as part of the Applied Statistical Analysis for Business Insights course. The program emphasizes statistical reasoning, data interpretation, experimentation, and AI-assisted analytics to support evidence-based decision-making and solve real-world business problems.
The program follows NIIT’s Mastery Learning methodology, focusing on building one skill at a time through structured, hands-on sprints. Each sprint includes concept introduction through live mentor sessions, individual practice and assignments, mentor review and feedback, and refinement with re-submission of work. Learners typically spend around 4 hours per sprint, with most of the time dedicated to hands-on application and reflection
Yes. Learners complete multiple sprint assignments and an 11-phase capstone project based on one of 10 real-world business scenarios.
By the end of the program, learners build a portfolio that includes dashboards, analysis reports projects, and an executive presentation that demonstrates applied analytics and AI-augmented analytics skills to employers.
Yes, the sprint structure and mentor feedback loop are built specifically so learners do not fall behind.
Each sprint pairs a 2-hour mentor-led session with 2 hours of guided hands-on practice, allowing learners to apply concepts immediately, followed by assignment feedback before the next sprint begins.
Graduates can pursue roles such as:
Taking a loan is entirely optional. Loans are facilitated by third-party lenders, and NIIT has no role in the process. Applicants must review the loan terms carefully, including EMIs, interest rates, processing fees, and repayment schedules. All EMI payments and related queries must be handled directly with the lender.
Documents may include PAN Card and Aadhaar Card, last 6 months’ bank statements, 3 months’ salary slips (for employed learners) or ITR proof (for self-employed), and co-applicant details if the learner is under 21 years of age. Incomplete documentation may result in loan rejection.
Learners use several Generative AI, AI-assisted development, analytics, and automation tools throughout the program, such as:
These tools support prompt engineering, AI-assisted coding, formula generation, dashboard development, SQL workflows, automated exploratory data analysis, statistical interpretation, and LLM-powered analytics workflows.
Learners apply them across courses and projects for data preparation, coding, and business communication while validating AI-generated outputs and retaining ownership of analytical decisions.
You need a laptop with stable internet connectivity. The program uses:
Learners need a laptop or desktop with Intel i3 or AMD Ryzen 3 (or higher), at least 8 GB RAM, and 50 GB free disk space, along with a functional webcam and microphone. The system should run Windows 10 or macOS (or higher) with the latest Chrome or Edge browser, MS Office or equivalent tools, and a PDF reader installed. A stable Wi-Fi or broadband connection with a minimum speed of 5 Mbps is required, and a backup internet connection is recommended.
Yes, learners receive a digital certificate after successfully completing the program and meeting all the required conditions (overall performance score, attendance, payment clearance etc).
However, to obtain additional certification through the Confederation of Indian Industry (CII), learners are required to make a separate payment via the National Council for Vocational Education and Training (NCVET) portal.
Placement support is offered based on the learner’s profile and eligibility. Learners eligible for Placement Assistance may receive up to a defined number of selection opportunities within 120 days of joining the Placement Bank, subject to criteria such as minimum 70% overall score, graduation, age below 28 years, and stream eligibility as per the Program Eligibility table. Final year undergraduate learners will become eligible only after completing graduation, where applicable. Support also includes three personalized coaching connects, end-to-end assistance during placement drives, and 7 Placement Preparation Module sessions covering interview preparation, aptitude, digital profile building, corporate etiquette, personality development, industry talks, and alumni talks. Learners aged 28 years or above will be eligible for Career Support, which includes access to relevant lateral opportunities through the Alumni forum for up to 120 days, based on hiring demand and role fit. Final selection depends on the learner’s preparation, participation, and performance in the hiring process.
Hassle-Free Refund Policy
Your satisfaction is our priority. We offer transparent refund terms for your peace of mind.
100% Money-Back Guarantee
Full refund (excluding the booking fee) if you cancel before the batch starts
Quick Refund Review
Eligible refund requests are carefully reviewed within seven working days
Transparent Refund Timeline
Approved refunds are completed within 45 days for timely settlement
Important: Enjoy a transparent refund policy. Cancel 48 hours before the class start date to be eligible for a refund if you haven’t attended any class.
Tell us your preferred slot
Custom Schedule Assistance
Investment Plan
Secure your future today
Exclusive of 18% GST
Secure your seat with a token booking fee of ₹1,500 today.
Exclusive of 18% GST